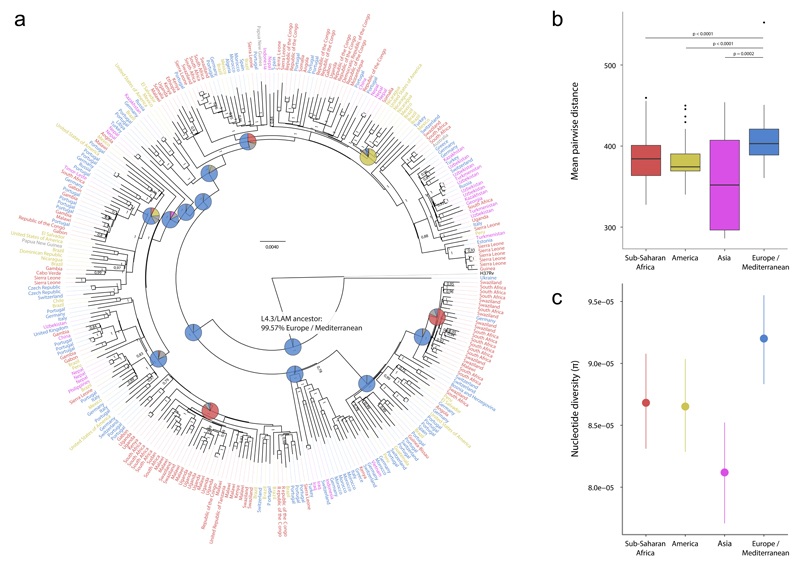
Figure 6. Genome-based phylogeny and diversity by continent of 293 strains of the L4.3/LAM sublineage.
(a) Bayesian phylogeny with label colors indicating continent of strain origin: blue, Europe/Mediterranean; red, Sub-Saharan Africa; yellow, America; pink, Asia. Numbers on nodes indicate posterior probabilities. Pie charts indicate reconstructed ancestral geographical regions of the internal nodes. The hypothetical L4.3/LAM-ancestor is labeled and a European origin for this ancestor was supported using a Bayesian Method (shown) and a Maximum Parsimony method (Supplementary Fig. 14). The pie colors correspond to the colors of the taxa labels. (b) Boxplot of pairwise genetic distances (number of polymorphisms) of L4.3/LAM strains by continent (p-values from Wilcoxon rank sum test). (c) Nucleotide diversity per site (π), measured by continent. Error bars indicate 95% confidence intervals. MTBC isolates from countries of the continent group “Oceania“ (UN category; including Australia and New Zealand, Melanesia, Micronesia and Polynesia) were excluded for the genetic diversity analysis in panels B and C due the low number of samples.

