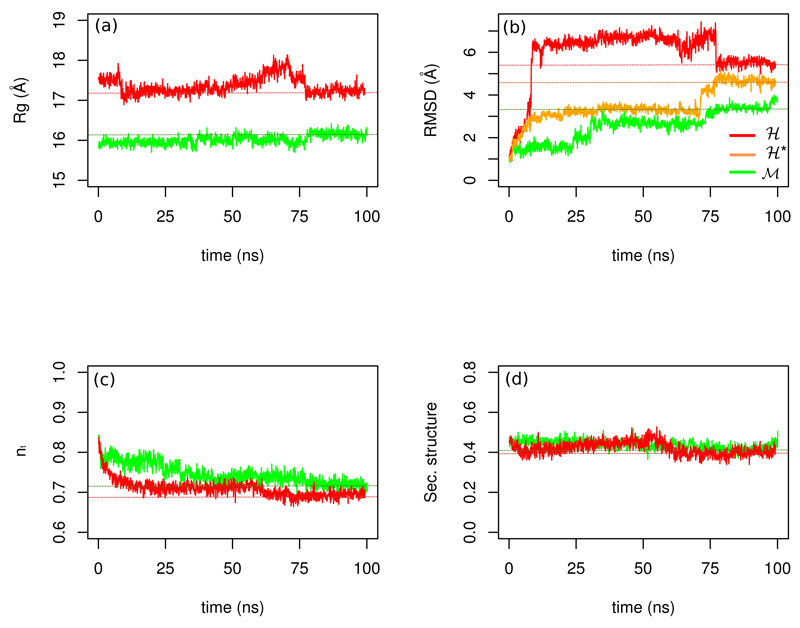
Figure 1.
Timeline of (a) radius of gyration Rg (b) rigid-core Cα RMSD, (c) fraction of native torsion angles nt and (d) fraction of secondary structure along the sequence for the OPEP MD simulations of the two systems at 300 K. Data in red refer to the ℋ protein and data in green to the ℳ protein. In panel (b) the orange curve ℋ* refers to a calculation performed after removing the contribution from helices α1 and α2 of the switch I region (see Fig. S1 of SI).

