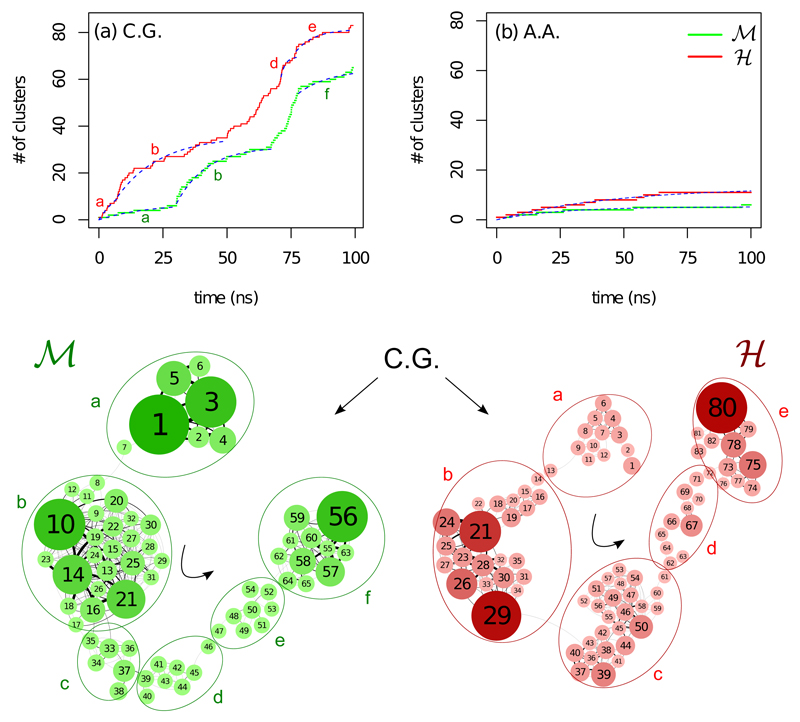
Figure 2.
Conformational substates at 300 K. Top: Number of clusters versus time for (a) the CG and (b) the AA MD simulations at 300 K. The dashed blue lines correspond to an exponential fit on the function N = N∞(1 −e−t/τ). Bottom: Network representations [37] of the coarse-grained MD simulations clusters shown in (a) drawn with a force based algorithm for ℳ on the left and ℋ on the right. The larger ellipsoidal borderlines outline the basins of attraction extracted using a Markov clustering algorithm with a granularity parameter equal to 1.2 [29]

