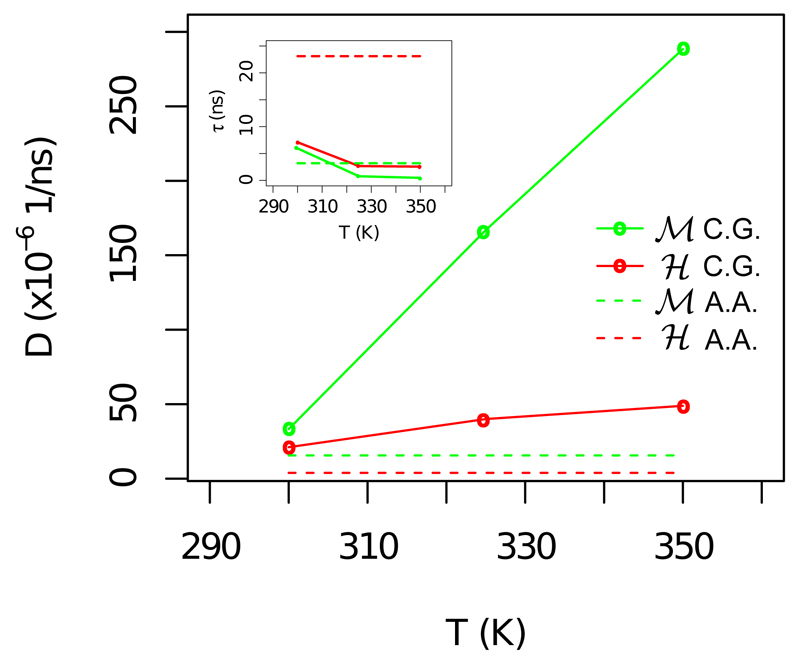
Figure 3.
Diffusion in a harmonic basin of attraction. Main plot: In solid lines we report the diffusion coefficients versus temperature for nt as estimated for the OPEP simulations. In dashed lines we report the value of D as estimated in our previous all-atom approach for nt at T=300 K [9]. Inset: Characteristic decorrelation time of δnt with respect to the temperature. The decorrelation time is always smaller for ℳ in agreement with our previous AA results.

