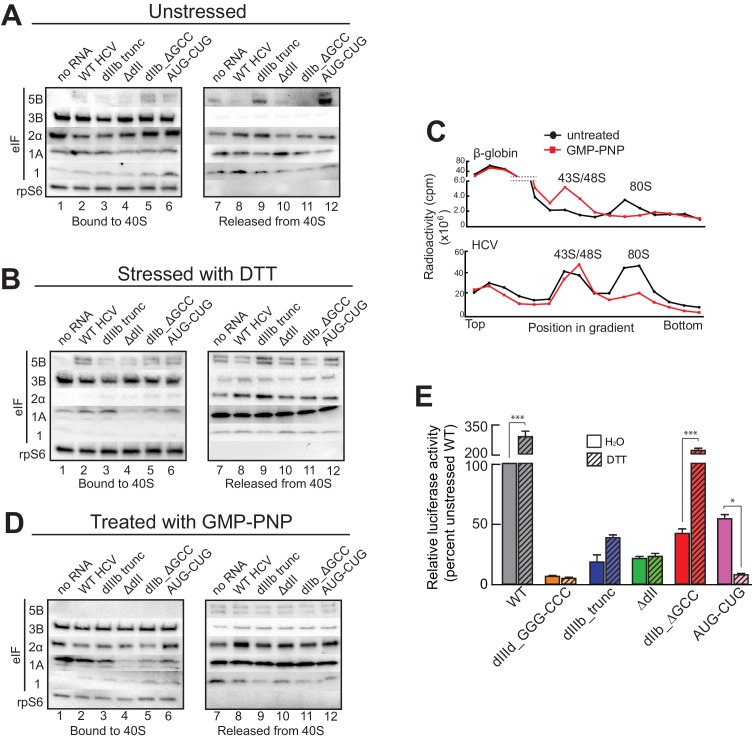
Figure 4. HCV IRES binding alters natively purified PICs into complexes suited for IRES-driven translation.
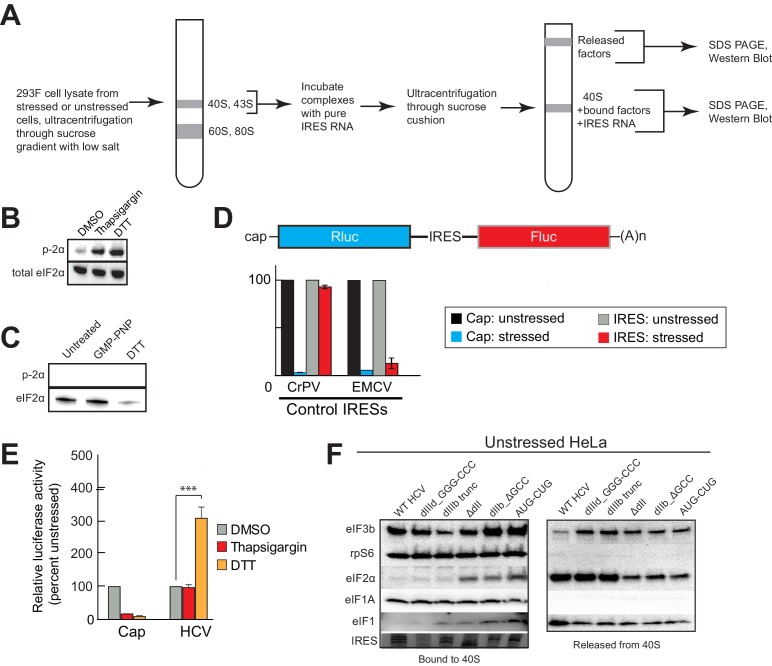
(A, B, and D) Results of the experimental protocol shown in Figure 4—figure supplement 1. Natively purified 40S subunit-containing complexes were challenged with WT HCV IRES, then the composition of the complex (bound to 40S) and the factors released (released from 40S) were analyzed using western blot analysis. Panel (A): PICs from unstressed 293F cells. Panel (B): PICs from 293F cells stressed with dithiothreitol (DTT). Panel (D): PICs from unstressed cells incubated with non-hydrolyzable GTP analog GMP-PNP. (C) 80S ribosome formation on radiolabeled β-globin leader or HCV IRES in treated 293F lysate either untreated or treated with GMP-PNP. Reactions were fractionated by ultracentrifugation through a sucrose gradient. Total radioactivity per fraction is plotted. (E) Translation from bicistronic reporter mRNA (Figure 3A) containing WT or mutant HCV IRES, used to transfect Huh 7.5 cells that were left untreated (H2O control) or pretreated with DTT. Translation of Fluc is plotted relative to translation of WT HCV IRES reporter in unstressed cells (set to 100%). Error bars represent averages ±SEM of ≥3 independent experiments. Statistical significance shown by: *p<0.05, **p<0.01, ***p<0.001.
DOI: http://dx.doi.org/10.7554/eLife.21198.008


