
Figure 4. Conduct virus dilution study.
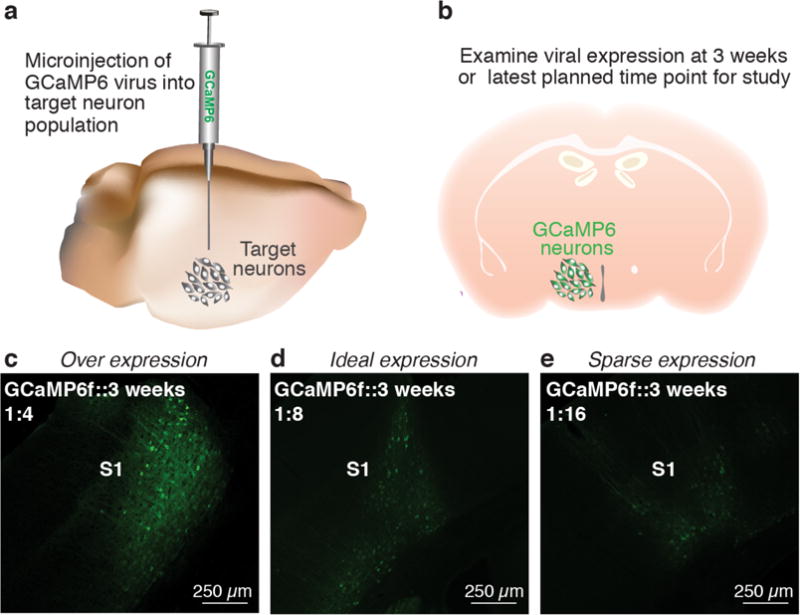
(a) Microinject GCaMP6 virus into target neuron population. (b) Allow the virus to express for at least 3 weeks before examining expression level of indicator. (c-e) Confocal images showing GCaMP6f expression within the somatosensory (S1) cortex of a wild-type mouse (DIO-GCaMP6f; Titer: 3.9 × 10¹², UNC vector core). (c) 1:4 dilution shows overexpression of GCaMP6f in cortical neurons as indicated by cells that lack a honeycomb appearance. (d) 1:8 dilution shows ideal expression of GCaMP6f as there is a relatively large amount of healthy looking cells expressing the GCaMP6f virus. (e) 1:16 dilution shows sparse expression of GCaMP6f. Ca2+ signals from such expression will be more difficult to detect compared to the 1:8 dilution and yield low cell count.