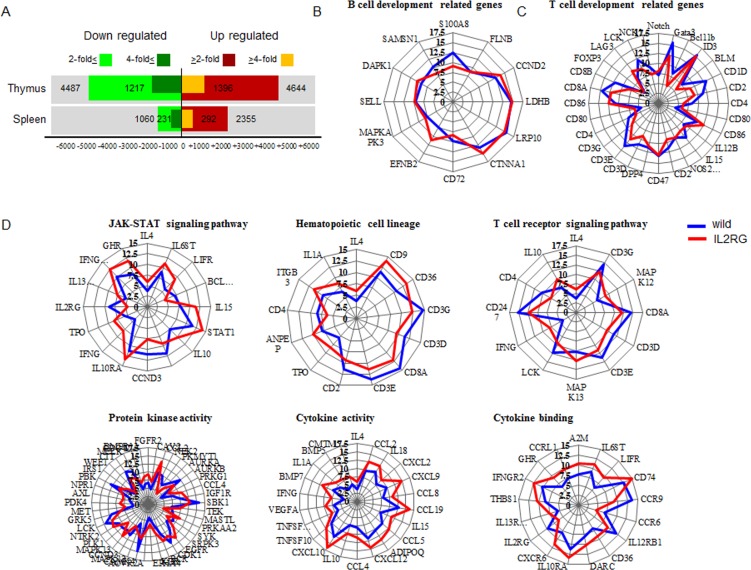
Figure 5. Microarray and ingenuity pathway analysis.
A. Up- and down- regulated gene numbers in mIL2RG+/Δ69-368 KO pig-derived spleen and thymus compared with WT. IPA indicate that B cell development related genes in spleen showed similar expression pattern compared to WT B., whereas T cell development related genes showed slightly down-regulated expressions in mIL2RG+/Δ69-368 KO pigs-derived thymus than those of WT C. To predict T cell development-related gene expression profiles in in mIL2RG+/Δ69-368 KO pig-derived thymus, each T-cell signaling pathways were analyzed using IPA D. JAK-STAT signaling pathway including hematopoietic cell lineage, T cell receptor signaling pathway, and protein kinase activity in mIL2RG+/Δ69-368 KO pig derived-thymus showed very similar expression patterns compared to those of WT. Of note, cytokine activity and cytokine binding-related gene expression in mIL2RG+/Δ69-368 KO pig-derived thymus are significantly upregulated than those of WT. Blue and red color line indicate WT and mIL2RG+/Δ69-368 KO pigs, respectively.

