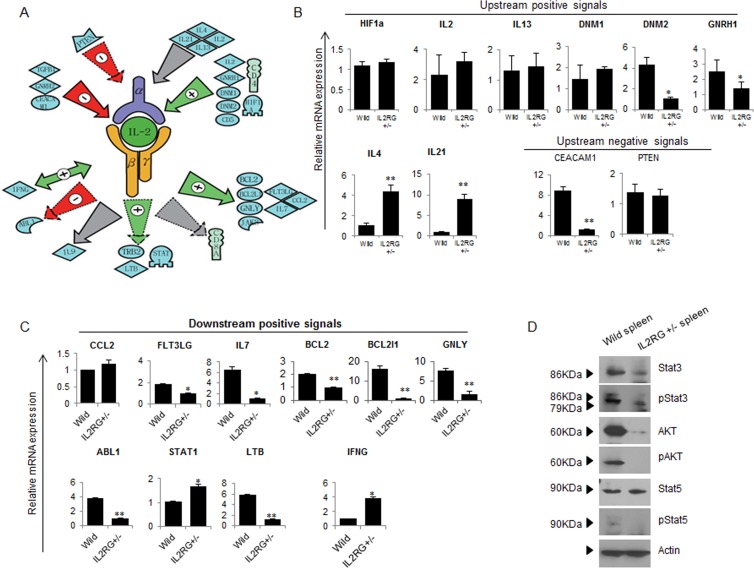
Figure 6. Studio pathway analysis of IL2RG signaling in mIL2RG+/Δ69-368 KO pig.
A. Functional correlation and interaction of IL2RG signaling using the Pathway Studio software (Ariadne Genomics Inc.; Rockville, MD, USA). All genes are shown by their gene symbols. Direct and indirect regulation are indicated by colored lines and dotted gray lines, respectively. B. and C. RT-qPCR validation of IL2RG upstream (B)- and downstream (C)-related gene expression proposed by Studio Pathway Analysis. D. A western blot analysis of AKT, pAKT, STAT5, pSTAT5, STAT3 and p STAT3 was performed in thymus of WT and mIL2RG+/Δ69-368 KO pigs. B actin mRNA expression, which used as an internal positive control in both of WT and mIL2RG+/Δ69-368 KO pig-derived thymus, was found to be similar. The data are representative of three experiments.

