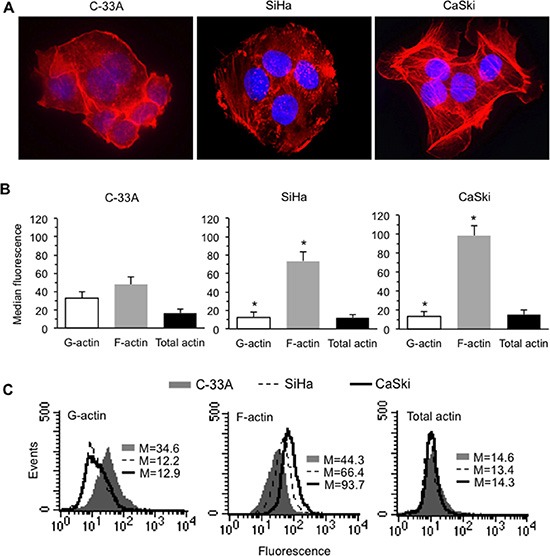
Figure 1. HPV16 DNA expression and actin cytoskeleton remodeling in CC cells.

(A) IVM analysis after TRITC-phalloidin/Hoechst double cell staining. Magnification, 700 ×. (B) Bar graphs showing the semi-quantitative flow cytometry analysis of intracellular amount of G-actin, F-actin and total (G + F) actin in C-33A (left panel), SiHa (central panel), and CaSki (right panel). Mean ± SD of the median fluorescence intensity obtained in four different experiments is reported. (C) Flow cytometry histograms obtained in a representative experiment are shown. Numbers represent the median fluorescence intensity. (*) indicates P < 0.01 vs. the corresponding bar of C-33A.
