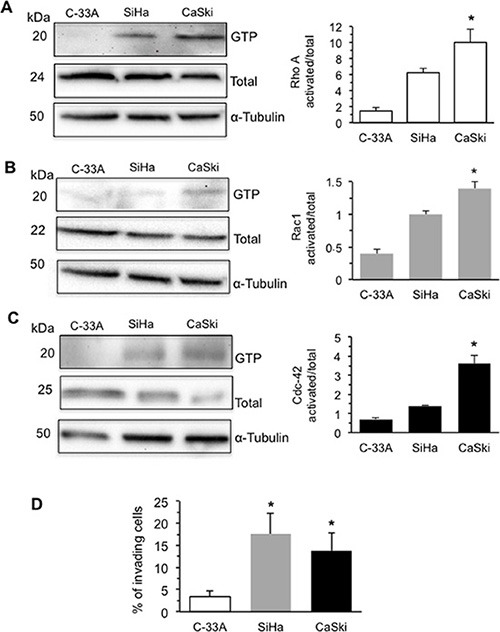
Figure 2. HPV16 DNA expression and activation of Rho GTPases and increases cell invasion.

Rho GTPase activation in human CC cells C-33A (E7-null cells), SiHa (2 copies of HPV16 DNA per cell), and CaSki (600 copies of HPV16 DNA per cell). Activation was measured by pull-down assays using the RBD domain of Rhotekin for (A) RhoA or the PBD domain of PAK for (B) Rac1 or (C) Cdc-42, followed by immunoblotting with the respective antibodies. Additionally, RhoA, Rac1, or Cdc-42 from total lysates was used as loading controls. In the right panels bar graphs show the active forms of RhoA, Rac1, and Cdc-42 GTPase (GTP-bound levels/total levels). The mean ± SD of the results obtained in three independent experiments is shown. (D) Invasion test on C-33A, SiHa and CaSki cell lines performed in vitro by using transwell culture inserts (8.0-μm pore size) coated with Matrigel. Data are reported as mean ± SD of the percentage of invading cells obtained in three independent experiments. (*) Indicates P < 0.01 vs. C-33A.
