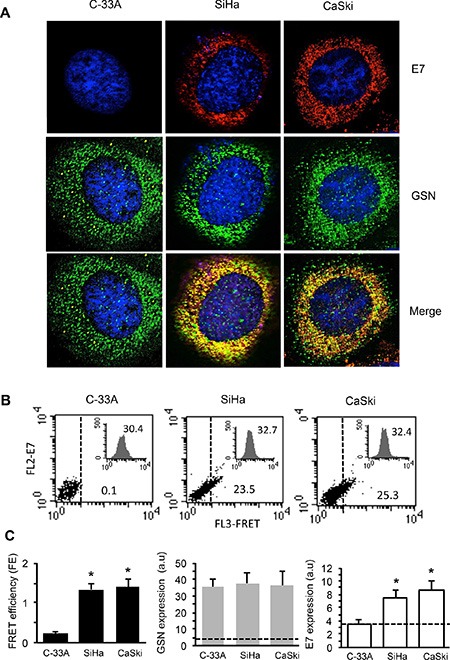
Figure 3. E7 interacts with GSN in carcinoma cells.

(A) IVM analysis after triple staining with anti-GSN/anti-E7/Hoechst in C-33A, SiHa and CaSki cells. Yellow fluorescence areas indicate the co-localization. Magnification 1,500×. (B) Quantitative evaluation of GSN/E7 association by FRET technique, as revealed by flow cytometry analysis. Numbers indicate the percentage of FL3-positive events obtained in one experiment representative of three. Inserts represent GSN intracellular amount in the corresponding sample and was quantitatively expressed by the median fluorescence intensity. (C) Left panel. Bar graph showing the evaluation of FE of GSN/E7 association. Numbers represent the FRET efficiency (calculated by using Riemann's algorithm) and are reported as the mean ± SD of data obtained in three independent experiments. Central panel and right panel show the mean ± SD of GSN and E7 intracellular amount, respectively, obtained from three independent experiments and quantitatively expressed by the median fluorescence intensity. Dashed lines designate the median fluorescence value of a negative control (baseline). (*) Indicates P < 0.01 vs. C-33A cells.
