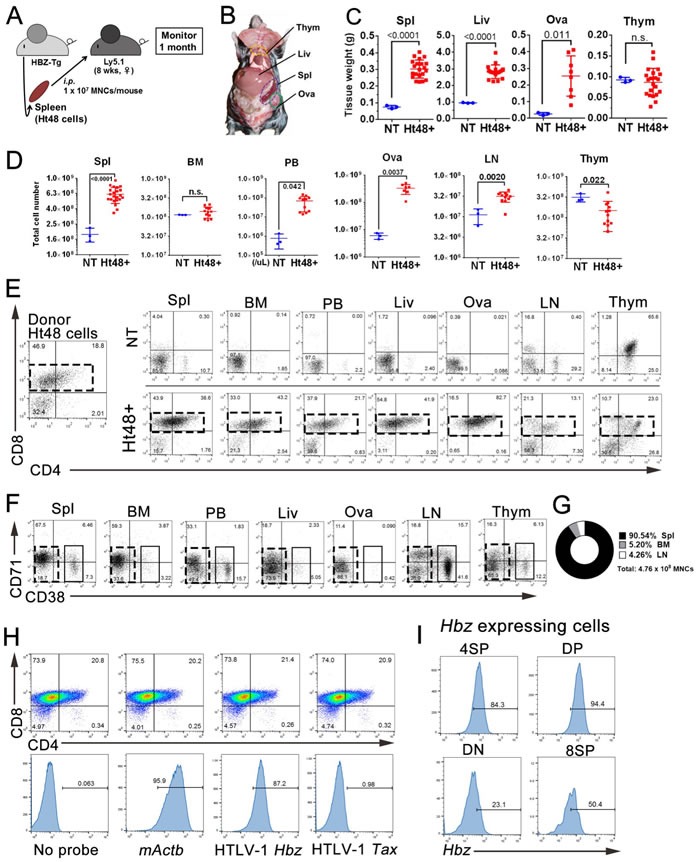
Figure 1. Assessment of the in vivo tumor initiating ability of HBZ-expressing mouse ATL cells (Ht48).

A. Schematic representation of this experiment. We transplanted 1×10⁷ Ht48 cells derived from HBZ-Tg mouse splenic lymphomatous cells intraperitoneally (i.p.) into C57BL/6 (Ly5.1) mice. B. The gross anatomy of the recipient mouse 20 days after Ht48 cell transplantation. C.-D. Graphs depicting the weight C. and the cell number D. of each tissue after Ht48 cell transplantation. Each mouse is represented by a dot. Horizontal lines indicate the median. NT, no transplant; Ht48+, Ht48 cell transplantation; n.s., not significant. E.-F. Flow cytometric analyses to detect CD4 and CD8 expression E. or CD71 and CD38 expression F. in donor Ht48 cells from a recipient mouse. Representative flow cytometry plots of Ht48 cells before (left) and after transplantation (right) are shown. Boxes composed of red E. and F. or black F. dashed lines indicate the major Ht48 population. G. Graph depicting the percentage of the Ht48 cell distribution in each lympho-hematopoietic tissue. H. A flow cytometric analysis was performed using a Primeflow™ assay to detect HBZ transcript in Ht48 cells. The Ht48 cells were separated by forward and side scatter (FSC and SSC, respectively) and by CD4+ and CD8+ for each gene transcript. Representative flow cytometry plots are shown, and the histograms depict the expression level of each gene in Ht48 cells. No Probe, no probe hybridization; ACTB, mouse actin beta. I. Representative graphs of the HTLV-1 HBZ expression level in 8SP (CD4−CD8+), DP (CD4+CD8+), DN (CD4−CD8−), or 4SP (CD4+CD8−) Ht48 cells. Spl, spleen; BM, bone marrow (femur); PB, peripheral blood; Liv, liver; Ova, ovary; LN, lymph node (inguinal and axillary); Thym, thymus; NT, no transplantation.
