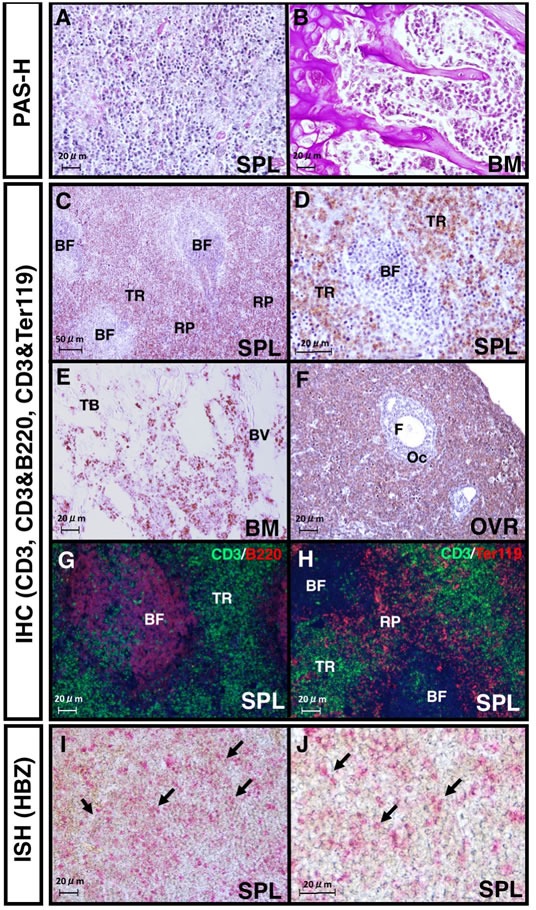
Figure 2. Histological analysis of lymphomas formed in the recipient spleens.

A., B. Images of PAS- and hematoxylin- stained spleen A. or bone marrow (BM) sections B. 20 days after Ht48 cell transplantation. C. CD3-staining image of a section of a lymphoma that formed in a recipient spleen. BF: B follicle zone; TR: T cell-rich zone; RP: red pulp. D. High magnification image of the CD3 immunostaining of the spleen. E. Image of CD3 staining of a lymphoma-infiltrated recipient BM section. TB: trabecular bone zone; BV: blood vessel. F. Image of CD3 staining of a section of lymphoma-infiltrated recipient ovary. OC: oocyte; F: follicle G.-H. Images from immunofluorescence detections (IHC) of CD3 and B220 or CD3 and Ter119 in a section of a lymphoma that formed in a recipient spleen. I.-J. Images from an in situ hybridization (ISH) analysis of the HBZ transcript levels in a lymphoma that was formed in a recipient spleen. Red dots show HBZ transcript. Arrows indicate HBZ expression in the lymphoma-formed spleen. All images shown are representative of repeated observations. Scale bar: 100 μm.
