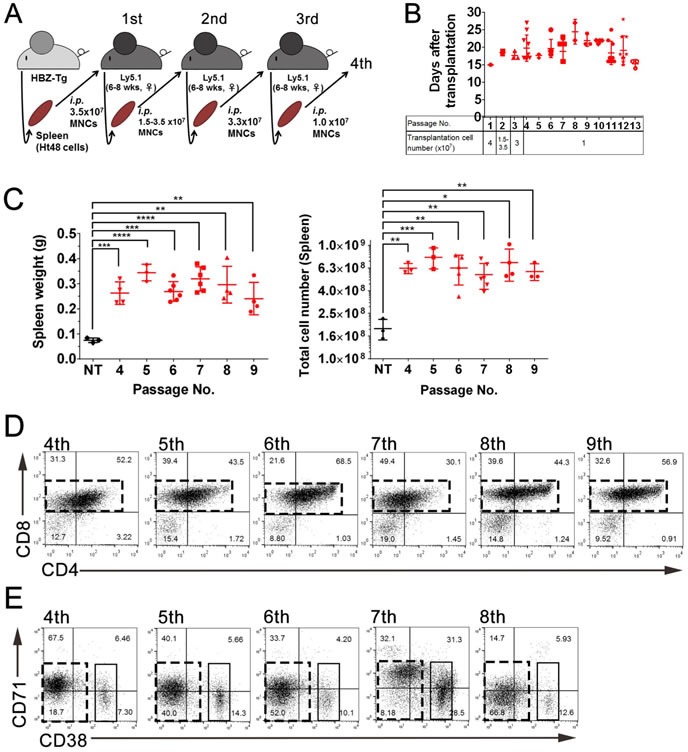
Figure 3. Evaluation of the in vivo ATLSC ability of Ht48 cells by a serial transplantation assay.

A. Schematic representation of the consecutive serial transplantation experiment. A total 1-4 ×10⁷ Ht48 cells were transplanted into C57BL/6 (Ly5.1) mice intraperitoneally (i.p) for the initial three consecutive serial transplantations, after which we transplanted 1×10⁷ Ht48 cells. wks, weeks B. Graph depicting the survival time after each of the 13 consecutive serial transplantations. Each mouse is represented by a dot. Horizontal lines indicate the median survival time. C. Graph depicting the spleen weight (left panel) and the number of MNCs in the spleen (right panel) at the sacrifice time points of passages 4-9 in the 13 consecutive serial transplantations experiment. Each mouse is represented by a dot. Horizontal lines indicate the median. NT: no transplantation control. **p < 0.05; ***p < 0.005; ****p < 0.0005. D.-E. Representative graphs from flow cytometric analyses to detect CD4 and CD8 expression D. or CD71 and CD38 expression E. in donor Ht48 cells from recipient mice after passages 4-9 D. or passages 4-8 E. in the 13 consecutive serial transplantations experiment. Boxes composed of red D. and E. or black E. dashed lines indicate the major Ht48 cell population.
