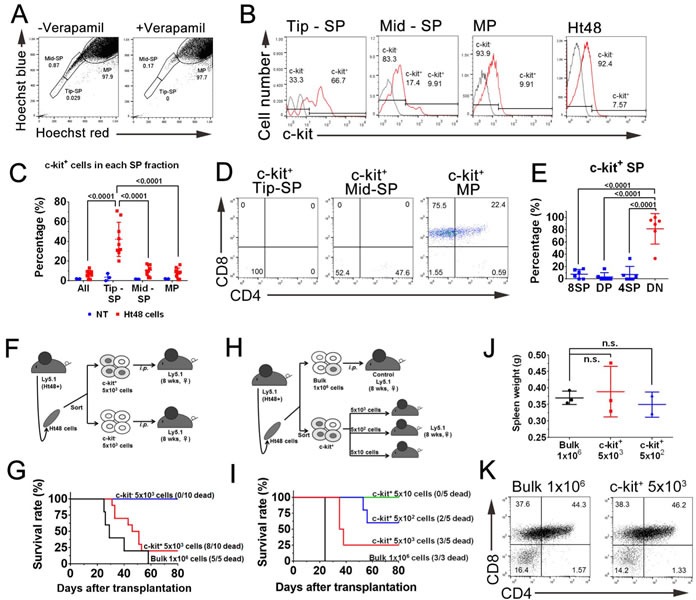
Figure 4. Evaluation of the dye efflux function in ATLSCs by a subpopulation analysis of Ht48 cells.

A. Representative flow cytometric dot plot of the SP analysis of Ht48 cells. The dot plots show control Ht48 cells incubated in Hoechst33342 alone (left) or in the presence of 100 μM verapamil (right). B. Representative histograms showing the proportion of c-kit+ cells in the Tip-SP, Mid-Sp, and MP fractions and in the unseparated Ht48 cells. C. Graph depicting the percentage of c-kit+ cells in the SP and MP fractions. D. Representative dot plots from a flow cytometric analysis to detect CD4 and CD8 expression in the c-kit+ SP donor Ht48 cells. E. Graph depicting the percentages of c-kit+ SP cells that were 8SP, DP, 4SP, or DN. Each mouse is represented by a dot. F. Schematic representation of the c-kit+ Ht48 cell transplantation experiment. A total of 5×10³ c-kit+ or c-kit− Ht48 cells or 1×10⁶ bulk Ht48 cells were transplanted intraperitoneally into C57BL/6(Ly5.1) mice. Ht48+, Ht48 cell transplantation G. The overall survival of recipient mice transplanted with 1×10⁶ Ht48 cells, 5×10³ c-kit+ cells, or c-kit− Ht48 cells. The overall difference in survival between mice transplanted with c-kit+ cells or c-kit− cells was statistically significant (p < 0.0001). H. Schematic representation of the follow-up c-kit+ Ht48 cell transplantation experiment. We intraperitoneally transplanted 5×101 to 5×10³ c-kit+ Ht48 cells or 1×10⁶ bulk Ht48 cells into C57BL/6 (Ly5.1) mice. I. The overall survival of recipient mice transplanted with 1×10⁶ bulk Ht48 cells or with 5×10 to 5×10³ c-kit+ Ht48 cells. The overall difference in the survival between each of the groups was statistically significant (p < 0.0001). J. Graph depicting the weight of the spleen at the sacrifice time point after the transplantation experiment described above. Each mouse is represented by a dot. Horizontal lines indicate the median value. K. Representative dot plots from a flow cytometric analysis to detect CD8 and CD4 expression in unfractionated Ht48 cells and c-kit+ Ht48 cells after they were transplanted into recipient mice.
