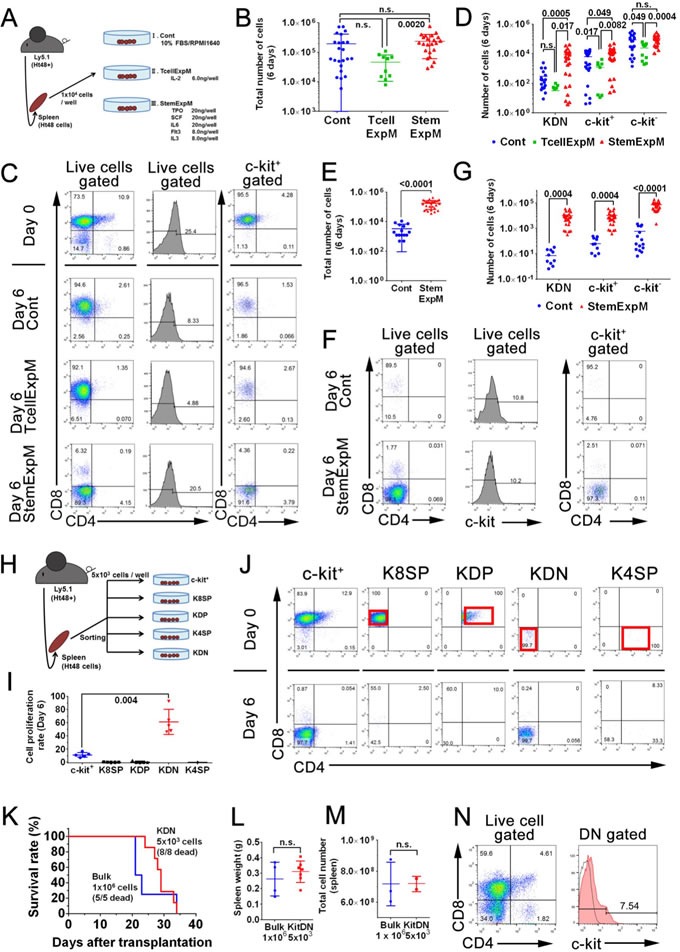
Figure 5. Effect of cytokine presence on ATLSC proliferation and differentiation.

A. Schematic representation of the in vitro Ht48 cell proliferation assay. A total of 1×10⁴ Ht48 cells were cultured under multiple culture conditions for 6 days. Control media (Cont) consisted of base media (RPMI1640 with 10% FBS) without cytokines. T cell expansion-inducing medium (TcellExpM) contained 6 ng/well IL-2 in base media. The stem cell expansion-inducing medium (StemExpM) contained five cytokines (20 ng/well TPO, 20 ng/well SCF, 20 ng/well IL-3, 8 ng/well IL-6, and 8 ng/well Flt3) in base media. B. Graph depicting the number of MNCs after a 6-day culture under the conditions described in (A). Each culture well is represented by a dot. Horizontal lines indicate the median number of MNCs. C. Representative dot plots from a flow cytometric analysis to detect CD4, CD8, and c-kit expression in donor Ht48 cells after a 6-day culture under the culture conditions described in (A). D. Graph depicting the number of c-kit+CD4/8DN (KDN), c-kit+, and c-kit− Ht48 cells after a 6-day culture under the conditions described in A. Each culture well is represented by a dot. Horizontal lines indicate the median number of cells. E. Graph depicting the number of MNCs after a 6-day culture of c-kit+ Ht48 cells under the conditions described in (A). Each culture well is represented by a dot. Horizontal lines indicate the median number of MNCs. F. Representative dot plots from a flow cytometric analysis to detect CD4, CD8, and c-kit expression in Ht48 cells after a 6-day culture of c-kit+ Ht48 cells under the conditions described in (A). G. Graph depicting the number of KDN, c-kit+, and c-kit− Ht48 cells after a 6-day culture under the conditions described in (A). Each culture well is represented by a dot. Horizontal lines indicate the median number of cells. H. Schematic representation of the in vitro Ht48 cell proliferation assay. Ht48 cells were subdivided and sorted as a c-kit+CD4−CD8+ (K8SP), c-kit+CD4+CD8+ (KDP), c-kit+CD4+CD8− (K4SP), and c-kit+CD4−CD8− (KDN) cells. A total of 1×10⁴ of each type of cells was cultured under StemExpM for 6 days. I. Graph depicting the fold increase change of each subset of Ht48 cells described in (H) after a 6-day culture in StemExpM. Each culture well is represented by a dot. Horizontal lines indicate the median fold increase change. J. Representative dot plots of a flow cytometric analysis to detect CD4, CD8, and c-kit expression in each subset of donor Ht48 cells described in (H) after a 6-day culture in StemExpM. K. A transplantation experiment with KDN cells was performed. The overall survival of recipient mice after receiving a transplantation of 5×10³ KDN cells or 1×10⁶ unfractionated Ht48 cells (Bulk) is shown. The overall difference in survival between these two groups is not statistically significant. L.-M. Graphs depicting the weight (L) and the cell number M of spleens after Ht48 cell or KDN transplantation. Each mouse is represented by a dot. Horizontal lines indicate the median. Ht48+, Ht48 cell transplantation; KDN, KDN transplantation; n.s., not significant. N. A representative dot plot from a flow cytometric analysis to detect CD4, CD8, and c-kit expression in donor Ht48 cells after transplantation of KDN.
