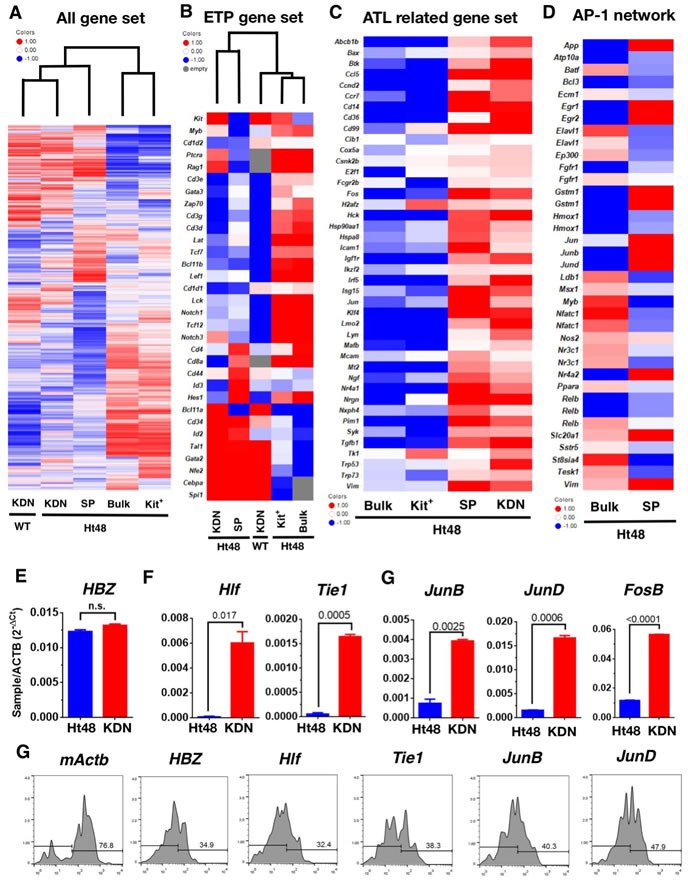
Figure 6. Global gene expression profile of Ht48 cells.

Ht48 cells were subdivided into c-kit+ cells, c-kit+CD4/8DN (KDN) cells, SP cells, and normal WT counterpart c-kit+CD4/8DN (WT-KDN) cells. A. Unsupervised hierarchal clustering of 15,882 gene expression profiles obtained from each fraction using an Agilent DNA microarray system. B. Hierarchal clustering of gene expression profiles obtained from each fraction using the ETP gene list. C. Gene expression profiles obtained from each fraction using the HTLV-1 infection and ATL-related gene list. D. Gene expression profiles obtained from each fraction using the AP-1 family gene network gene list. E.-G. A q-PCR analysis of differentially-expressed genes between unfractionated Ht48 cells (Bulk) and KDN cells. The expression levels of HTLV-1 HBZ E., randomly selected genes from upregulated genes in SP cells, Hlf, Tie1, F., and members of the AP-1 gene family including, Junb, Jund, Fosb in KDN G.. H. A flow cytometric analysis was performed using a Primeflow™ assay to detect q-PCR confirmed genes including, mActb, HBZ, Hlf, Tie1, Junb, and Jund in KDN cells. The Ht48 cells were separated by forward and side scatter (FSC and SSC, respectively) and by CD4+ and CD8+ for each gene transcript. Representative flow cytometry plots are shown, and the histograms depict the expression level of each gene in KDN cells.
