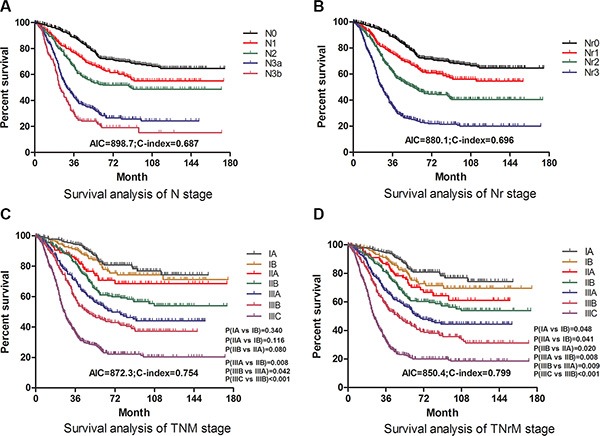
Figure 3. Comparative survival analysis on discriminatory ability and accuracy.

(A), survival curves of patients according to subgroups of N stage. (B), survival curves of patients according to subgroups of Nr stage. (C), survival curves of patients according to subgroups of TNM stage. (D), survival curves of patients according to subgroups of TNrM stage. The significance of difference between survival curves was calculated by the log-rank test.
