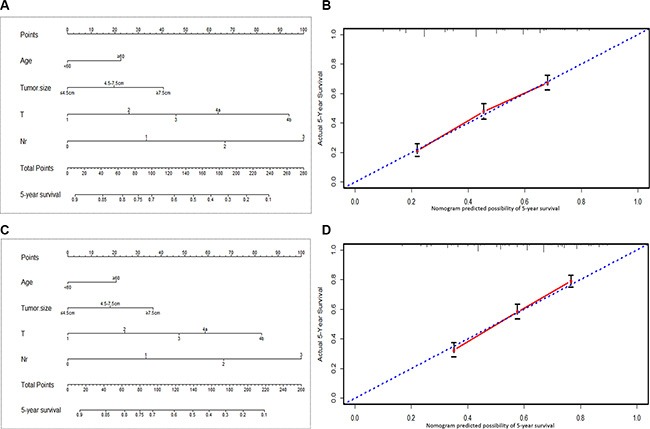
Figure 5. Nomogram plots and calibration curves based on Nr stage.

(A, B): nomogram plots and calibration curves in the training set. (C, D): nomogram plots and calibration curves in the validation set.

(A, B): nomogram plots and calibration curves in the training set. (C, D): nomogram plots and calibration curves in the validation set.