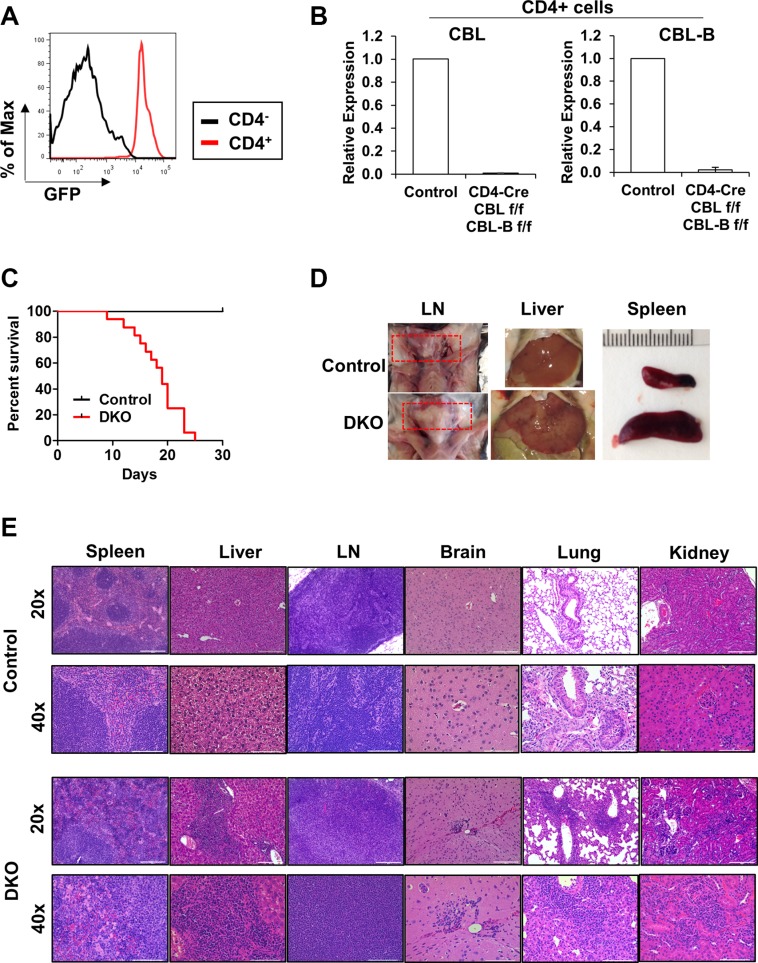
Figure 2. CD4-Cre induced CBL/CBL-B deletion leads to strong hematological phenotype.
(A) FACS analysis of splenocytes from DKO mice for the expression of GFP in CD4+ or CD4− cells. (B) mRNA expression levels of CBL (left) and CBL-B (right) were analyzed in FACS-sorted CD4+ cells of Control or DKO mice by quantitative real-time PCR. (C) Kaplan-Meyer survival curve of Control and DKO mice; n = 16. (D) Representative photos demonstrating lymph node hyperproliferation and hepatosplenomegaly. Red rectangle indicates lymph nodes (E) Representative H & E stained liver, spleen, lymph node (LN), brain, lung and kidney sections. Bar for 20× and 40× images represents 200 μm and 100 μm respectively.

