
Figure 2. VEGF-R2 and stem cell like markers are expressed on melanoma cells.
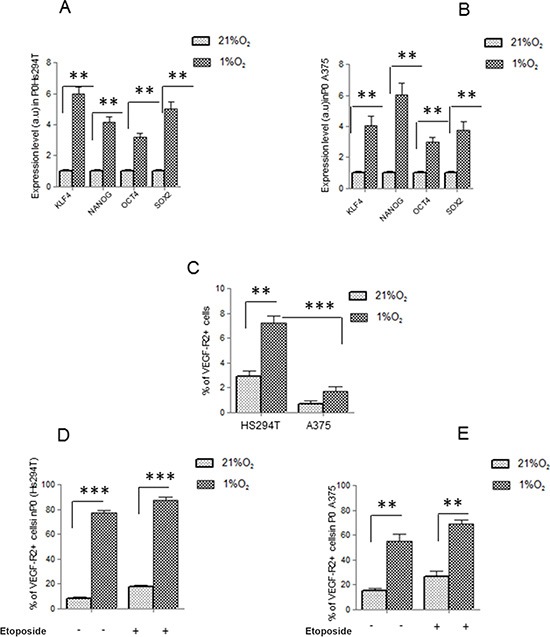
(A, B) mRNA evaluation of KLF4, NANOG, OCT4, SOX2 was performed in P0 spheres derived from Hs294T (left) and A375 (right). Values are reported as fold change with respect to relative normoxic samples. (C) Starved Hs294T and A375 cells were cultured under normoxic or hypoxic condition for 24 hours and VEGF-R2 expression was assessed by flow cytometry (D, E) P0 spheres derived from normoxic and hypoxic Hs294T (left) and A375 (right) cells were disaggregated and VEGF-R2 expression was analyzed by FACS analysis. P values of ≤ 0.05 were considered statistically significant *p < 0.05, **p < 0.001, ***p < 0.0001, n = 3.