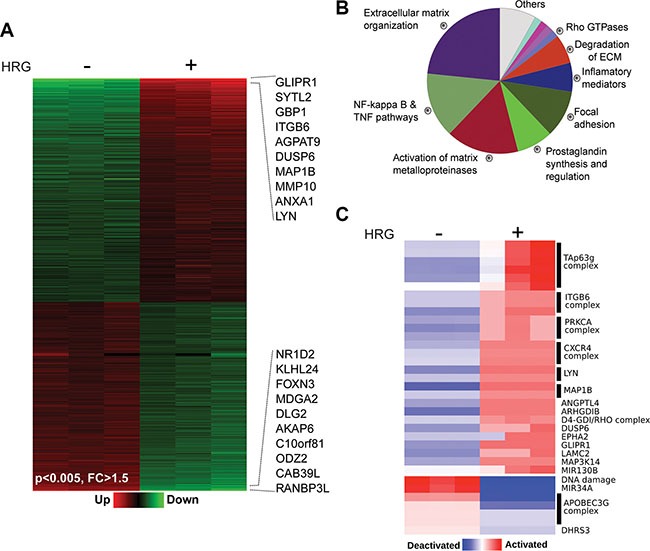
Figure 1. Changes in gene expression induced by HRG in T-47D cells.

T-47D cells were treated with HRG (20 ng/ml) or vehicle for 6 h. Total RNA from three replicates was extracted and reverse transcribed to cDNA. Gene expression profiling was carried out using an Affymetrix GeneChip Human Gene 1.0 ST Array. (A) Heatmap of the microarray data showing changes in gene expression by HRG (p-values < 0.005, fold changes (FC) > 1.5). The top 10 up- and down-regulated genes are indicated. (B) Enriched biofunctions of HRG-modulated genes, as determined by ClueGO analysis. The percentage of genes per term is proportionally represented in the pie chart. (C) PARADIGM inferences of the most variable integrated pathway activities using the normalized gene expression profiles of the HRG modulated transcripts.
