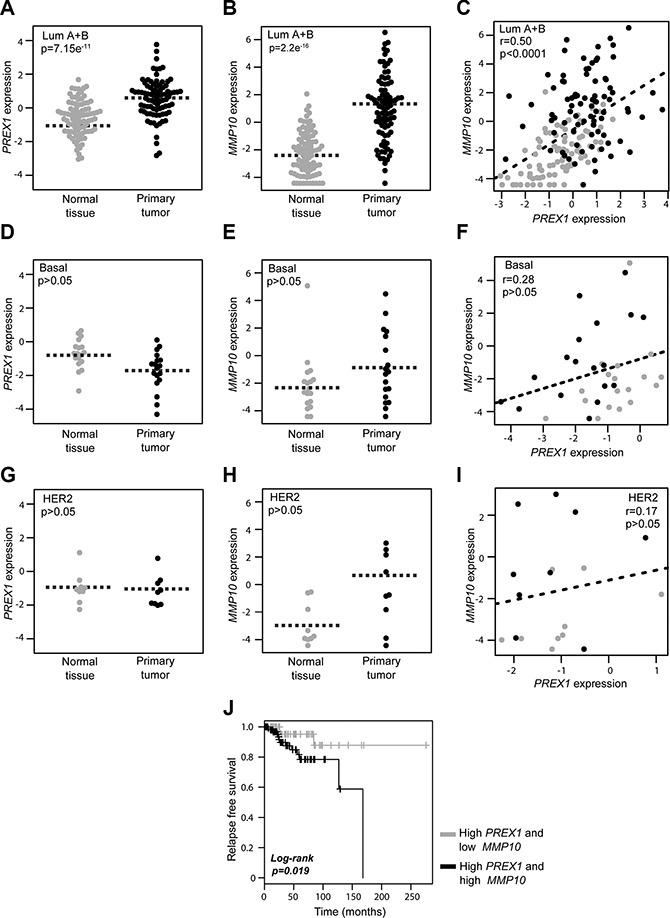
Figure 5. Expression of PREX1 and MMP10 in different breast cancer subtypes.

Comparison of PREX1 and MMP10 expression in paired breast carcinomas and normal tissues according to subtype was carried out using the TCGA breast cancer data obtained from the Xena resource. (A, D, and G) Expression of PREX1 in luminal, basal, and HER2 positive breast cancer. (B, E, and H) Expression of MMP10 in luminal, basal, and HER2 positive breast cancer. (C, F, and I) Correlation between PREX1 and MMP10 expression in luminal, basal, and HER2 positive breast cancer. (J) Kaplan-Meier curve analysis for P-Rex1 positive cases according to low and high MMP10 expression.
