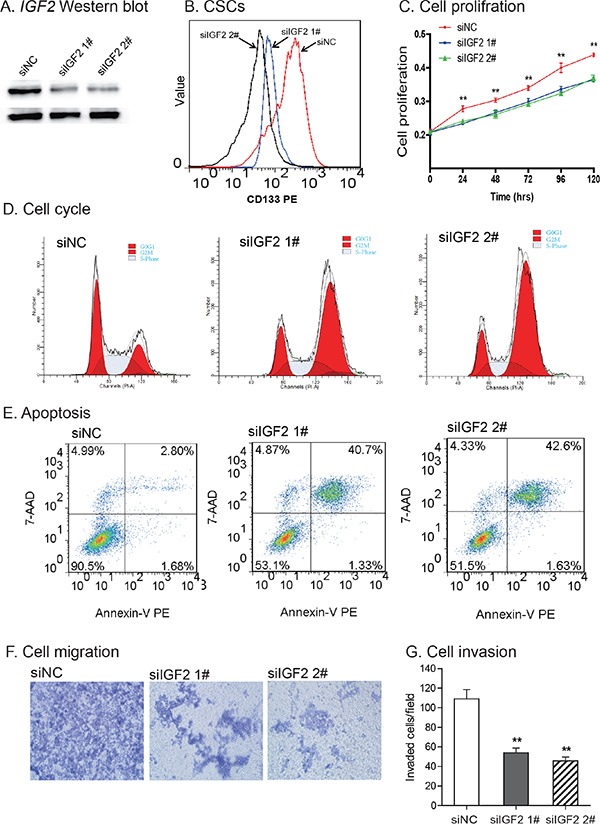
Figure 7. Knockdown of IGF2.

A. Knockdown of IGF2 by siRNAs (siIGF2 1#, siIGF2 2#). siNC: negative control siRNA. The abundance of IGF-II protein was quantitated by Western blot. B. IGF2 knockdown reduced CD133-positive cells. After siRNA treatment, CD133+ cells were analyzed by FACS. C. Reduced cell proliferation in IGF2-knockdown CSCs. **P<0.01 vs. control cells (siNC). D. Cell cycle analysis after interference of IGF2 expression. After treatment with the control siRNA (siNC) and IGF2 siRNA (siIGF2 1# and siIGF2 2#), cell cycle was analyzed by FACS. E. Apoptosis as measured by FITC Annexin V-FACS assay. F. Cell migration. IGF2 knockdown reduced cell migration in HCT116 CSCs. G. Cell invasion. Cells that invaded through the collagen-coated membrane of the transwell were counted. All data shown are mean±SEM from three independent experiments. *p < 0.05 as compared with control cells (siNC).
