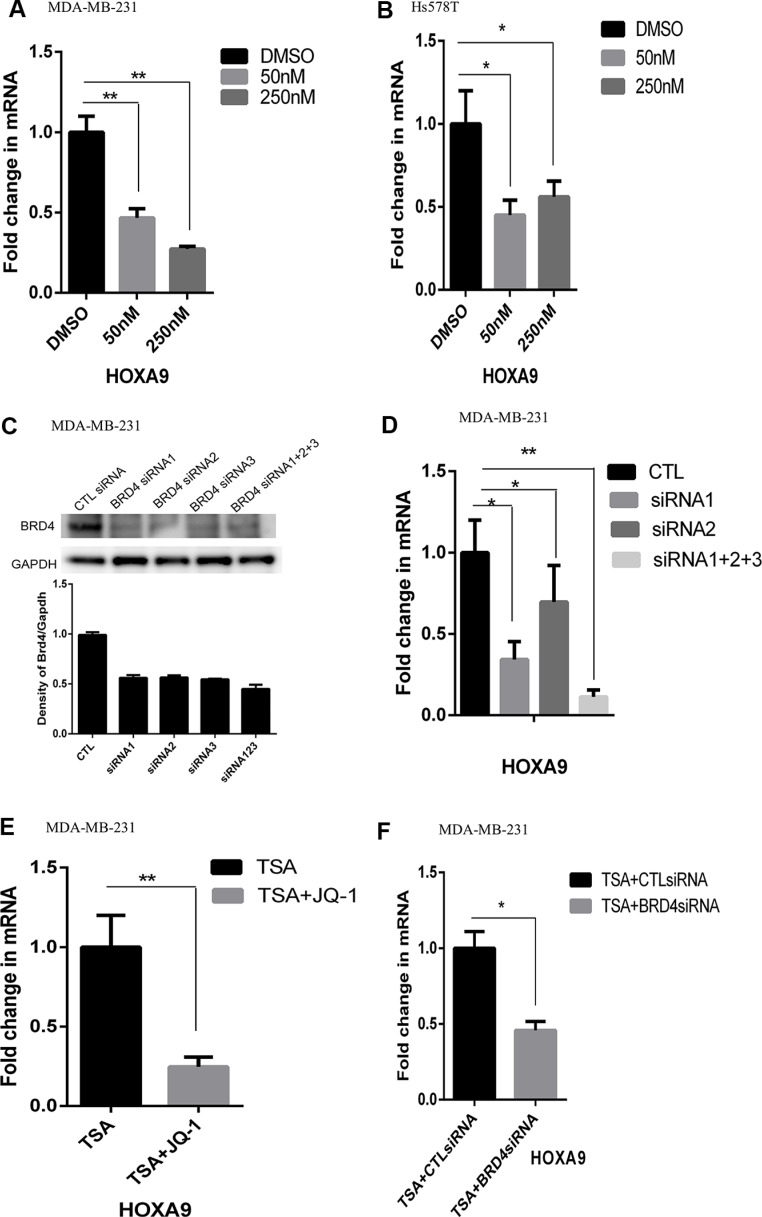
Figure 4. Reduced expression of HOXA9 by inhibition of BRD4.
(A) Total cell RNA was extracted from lrECM 3D cultures of MDA-MB-231 cells treated with either a BRD4-specific inhibitor JQ1 (50 and 250 nM) or DMSO for 4 days. The mRNA levels of HOXA9 were measured using qRT-PCR. A fold change of the HOXA9 mRNA was obtained by normalizing to the house keeping gene RPLP0 and setting the values from the DMSO treated group to one. (B) Similar to part A except that total RNA was extracted from Hs578T cells cultured under the same condition. (C) MDA-MB-231 cells were transfected with either BRD4-specific siRNAs (BRD4si, three distinct siRNA labeled as 1–3) or the matching control siRNAs (CTL siRNA). The protein levels of BRD4 were measured using immunoblots and quantified using densitometry. (D) MDA-MB-231 cells were transfected with either BRD4-specific siRNAs or the matching control siRNAs (CTL) and seeded in lrECM 3D culture. Total cell RNA was extracted on day 4 in lrECM 3D culture. The mRNA levels of HOXA9 were measured using qRT-PCR. A fold change of the HOXA9 mRNA in the BRD4-specific siRNA groups (siRNA1, siRNA2, siRNA1+2+3) over that in the CTL siRNA (CTL) group was obtained by normalizing to the housekeeping gene RPLP0 and setting the values from the CTL group to one. (E) Total cell RNA was extracted from 2D culture of MDA-MB-231 cells treated with either TSA (500 nM) alone or a combination of TSA and JQ1 (250 nM) for 72 hrs. The mRNA levels of HOXA9 were measured using qRT-PCR. A fold change of the HOXA9 mRNA in the TSA and JQ1 treated group over the TSA group was obtained by normalizing to the housekeeping gene RPLP0 and setting the values from the TSA group to one. (F) Similar to part E except that the mRNA levels of HOXA9 were measured in 2D culture of MDA-MB-231 cells exposed to TSA (500 nM) with transfection of control siRNA (CTLsiRNA) or the BRD4-specific siRNA (BRD4siRNA, a pool of siRNA1–3). When presented, means and standard deviations were obtained from three independent experiments. * and ** indicate a P value < 0.05 and 0.01, respectively.

