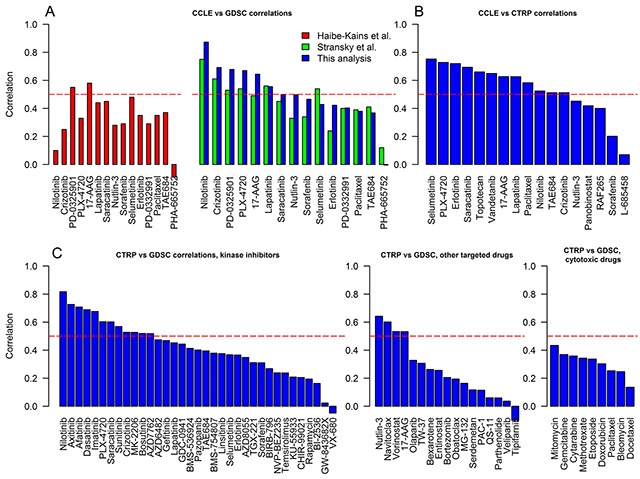
Figure 2. The correlations of cell line responses to individual drugs from CCLE, GDSC and CTRP.

A. CCLE and GDSC correlations. Pearson correlation (r) coefficients of adjusted AUCIC50 calculated by this study (blue bars) were matched to the similar analyses performed by Haibe-Kains et al. [5] (red bars, unadjusted AUC, Spearman correlation (ρ)), and Stransky et al. [6] (green bars, unadjusted AUC, r). B. CCLE and CTRP correlations (r, adjusted AUCIC50). C. CTRP and GDSC correlations (drugs are subdivided into kinase inhibitors, other targeted therapies, and cytotoxic chemotherapies; r, adjusted AUCIC50). Horizontal dashed line shows a threshold for moderate correlation (> 0.5).
