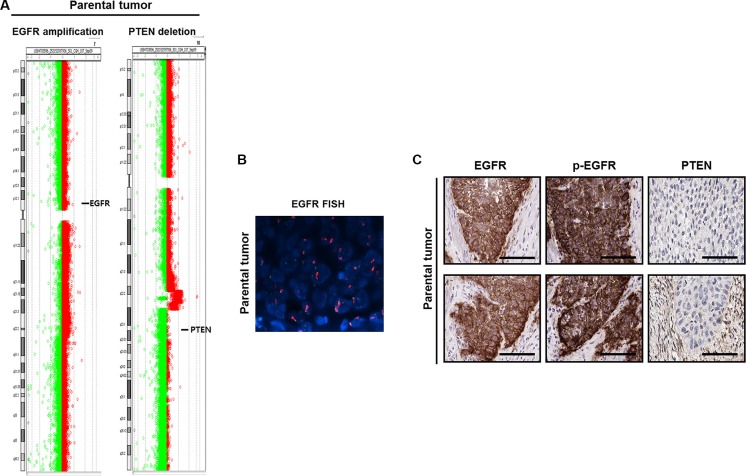
Figure 2. Identification of gene alterations in 138T muscle-invasive bladder cancer.
(A) Comparative genomic hybridization array analysis of the tumor from patient 138T, indicating the mutual EGFR amplification and PTEN deletion. Individual chromosome ratio plots are shown with red representing amplified regions and green representing deleted regions. High-level EGFR amplification in chromosome 7 (left). PTEN deletion in chromosome 10 (right). (B) Epidermal growth factor receptor (EGFR) amplification as assessed by FISH in 138T patient-derived cells (PDCs). Orange signal: EGFR; green signal: CEP7; blue signal: DAPI counterstaining. (C) Representative images of immunohistochemical staining of 138T PDC tumor tissue showing EGFR, p-EGFR (Tyr1068), and PTEN. Scale bars, 100 μm.

