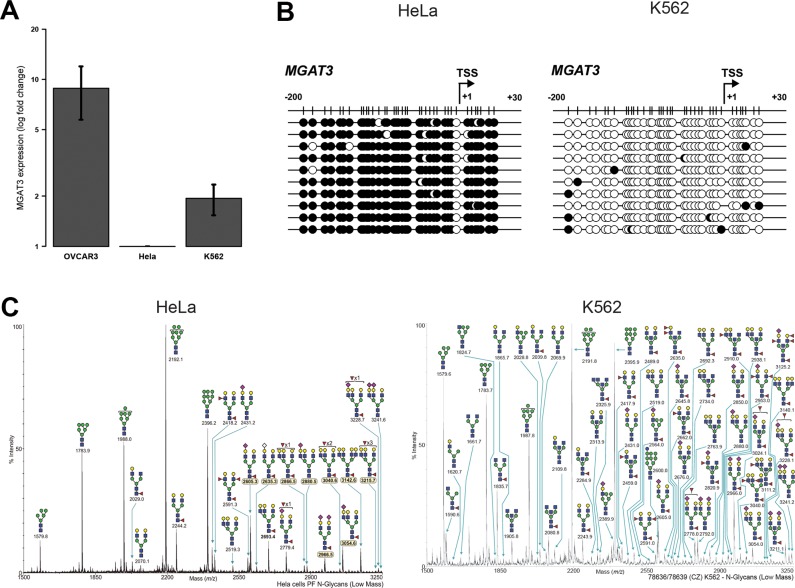
Figure 4. DNA methylation at −200/+30 from the TSS correlates with MGAT3 and bisecting GlcNAc expression in non-ovarian cancer cell lines.
(A) Gene expression analysis by RT-qPCR. (B) Bisulfite sequencing showing black circle (methylated CpG) and white circle (unmethylated CpG). (C) The annotated N-glycomes of HeLa and K562 cells were accessed and downloaded through the Consortium for Functional Glycomics (CFG, www.functionalglycomics.org). Low molecular weight N-glycans are depicted.

