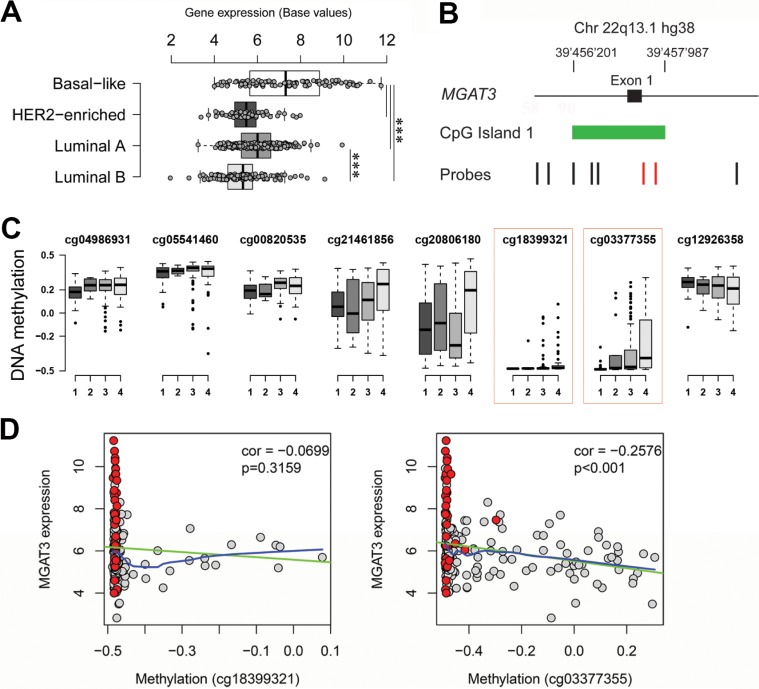
Figure 6. Elevated MGAT3 expression correlates with DNA hypomethylation in TCGA breast cancer data.
(A) Boxplot showing significantly elevated MGAT3 expression in basal-like breast cancer compared to HER2-enriched, luminal A and luminal B breast cancer (***p-value < 0.001). (B) Genomic localization of probes of the 450K HumanMethylation Bead chip (black and red vertical bars) at exon 1 (black box) of MGAT3. CpG island 1 is shown in green. (C) Boxplot displaying degree of DNA methylation (normalized by centering to 0) in the TCGA breast cancer cohort for selected probes (same order left to right as annotated in A). Degree of DNA methylation is shown for basal-like (1), HER2-enriched (2), luminal-A (3), and luminal-B (4) breast cancer (abscissa). Probes significantly discriminating four breast cancer groups are highlighted in the red dotted box. (D) Correlation plot for TCGA breast cancer samples matching MGAT3 expression and DNA methylation of probes cg18399321 and cg03377355 (red highlighted in A and B). Basal-like are highlighted in red while remaining breast cancer samples are grey. Correlation and p-value are shown in each plot. Linear and locally weighted polynomial regressions are shown in green and blue, respectively.

