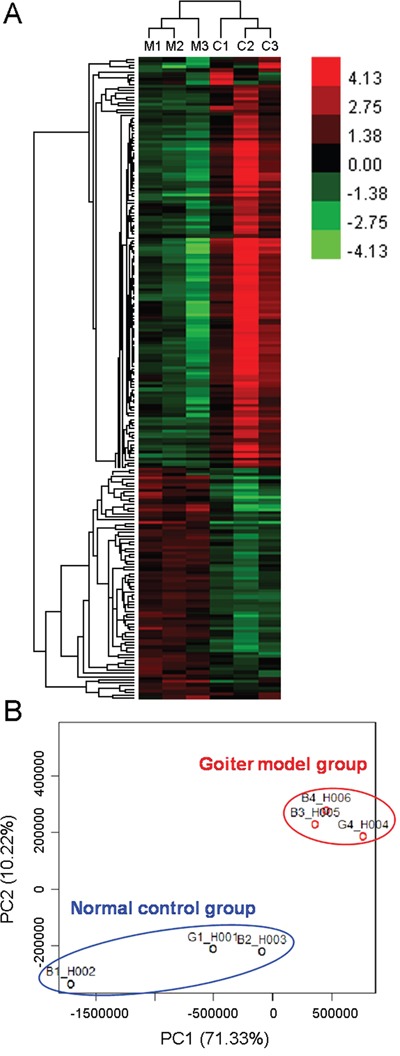
Figure 2. Unsupervised hierarchical clustering analysis (A) and principal component analysis (B) of all dysregulated genes in goiter model and normal control rats. Red represents a high expression while green represents a low expression. M1~M3, three samples in goiter model group; C1~C3, three samples in normal control group.

