
Figure 3. Goiter-related genes are implicated into alterations in hypothalamus-pituitary-thyroid/gonad/growth axes.
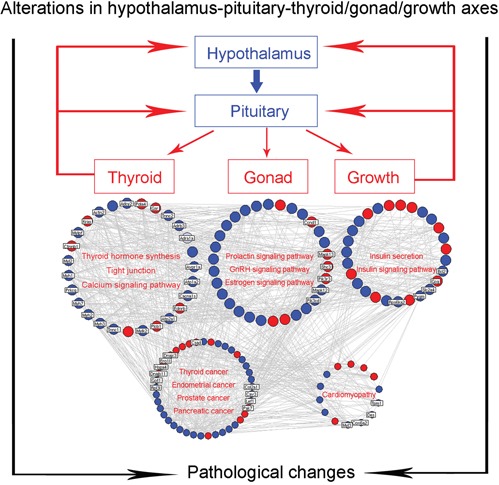
Blue nodes refer to the downregulated genes in goiter model group compared to normal control group; Red nodes refer to the upregulated genes in goiter model group compared to normal control group.