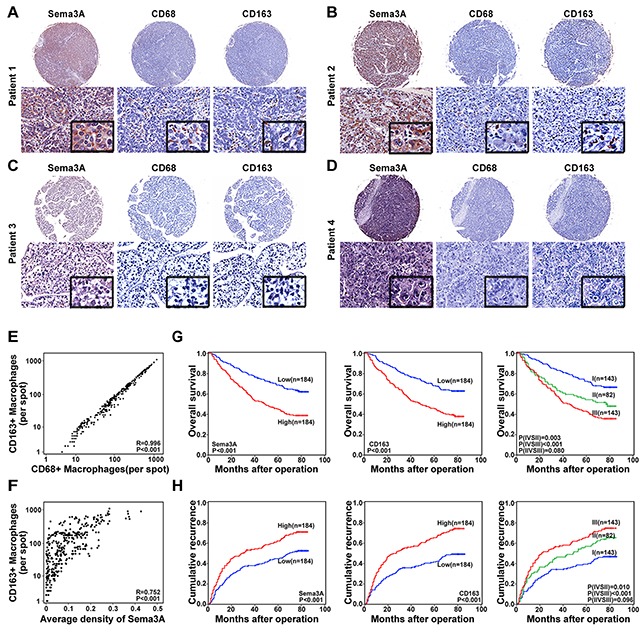
Figure 4. Expression and prognostic value of Sema3A and TAMs in carcinoma samples (cohort 3, n=368).

A–D. Representative HCC tumor samples, expression of Sema3A and TAM (CD68 and CD163). (A–B) High levels of expression, Sema3A and TAM. (C–D) Low levels of expression, Sema3A and TAM. E. Scatterplot results, statistically significant positive correlation, intratumoral CD68 and intratumoral CD163 levels in tumor tissue. F. Scatterplot results, statistically significant positive correlation, Sema3A and intratumoral CD163 levels in tumor tissue. G–H. Kaplan-Meier analysis results, Sema3A and intratumoral CD163 prognostic values. I, Sema3A low/intratumoral CD163low; II, Sema3Alow/intratumoral CD163high and Sema3Ahigh/intratumoral CD163low; III, Sema3Ahigh/intratumoral CD163high.
