
Figure 4. RT-qPCR and Kaplan-Meier analysis for predicting HULC as a GC prognosis biomarker.
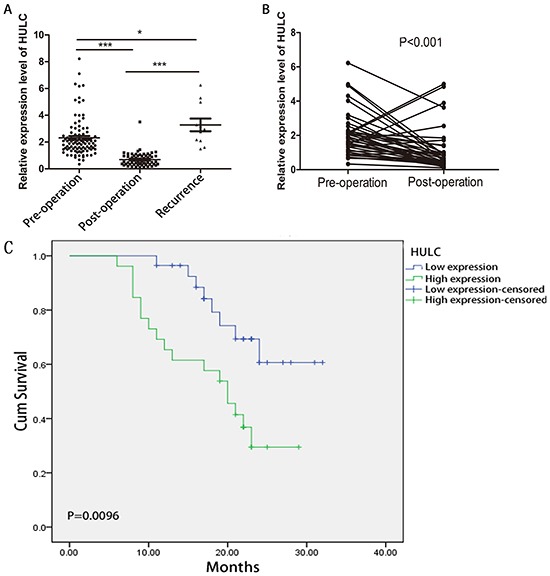
A. Scatter plots of serum HULC levels from pre-operative (n = 100), post-operative (n = 62), and recurrent patients (n = 11). B. Line chart of serum HULC levels monitored in the 40 surgical GC patients. C. Kaplan-Meier survival curve of patients with GC based on HULC expression levels. Patients in the high expression group (n = 27) had significantly poorer prognosis than those in the low expression group (n = 27) (P < 0.05).