
Figure 2. NEAT1 promotes tumor NSCLC cell growth in vitro.
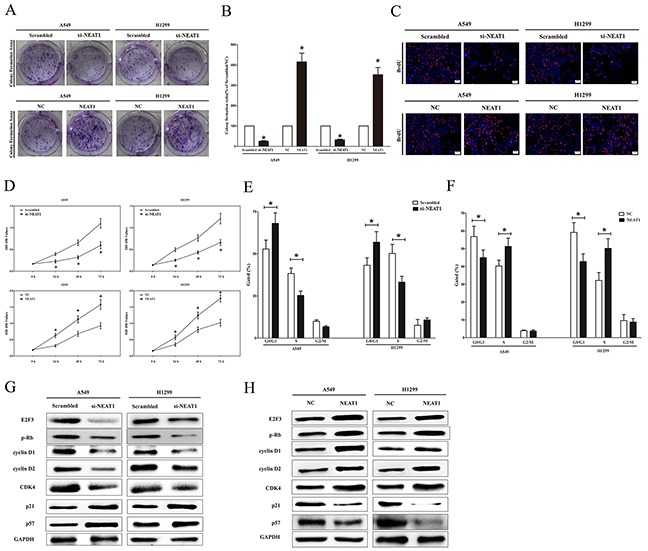
A. Shown are representative photomicrographs of colony formation assay after transfection for fourteen days. B. Statistical analysis of colony formation assay. C. Shown are representative photomicrographs of BrdU staining in A549 and H1299 cells after transfection. Bar = 100 μm. D. CCK8 assays of A549 and H1299 cells after transfection. F. Cell-cycle analysis was performed after transfection for forty eight hours. The DNA content was quantified by flow cytometric analysis. G. Expression of E2F3, p-Rb, cyclin D1, cyclin D2, CDK4, p21 and p57 protein in transfected A549 and H1299 cells. Assays were performed in triplicate. *P < 0.05. Means ± SEM are shown. Statistical analysis was conducted using student t-test.