
Figure 5. UPR to cisplatin-induced ER stress differed between cancer stem-like and cancer cells.
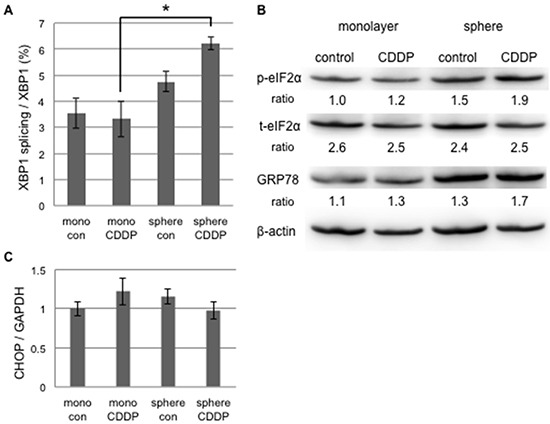
Monolayer (mono) or sphere-forming (sphere) cells were untreated (control: con) or treated with 20 μM cisplatin (CDDP) for 72 hours, and live cells were fractioned. A. Total RNA was extracted for RT-PCR and the ratio of spliced XBP1 mRNA to total XBP1 mRNA was calculated by the comparative Ct method. The values shown represent the means ± SEM (*p < 0.05). B. Cell extracts were prepared for Western blotting of the indicated proteins, and representative blots are shown. The ratio indicated that each protein level was normalized by β-actin levels (loading control). The phosphorylation of eIF2α was negligibly increased by the treatment with 20 μM cisplatin. C. The relative expression of CHOP was calculated and normalized by GAPDH. No significant change was observed in CHOP expression by the treatment with 20 μM cisplatin. The values shown represent the means ± SEM.