
Figure 7. Label distribution depending on the mechanism of reaction of the TKTL1.
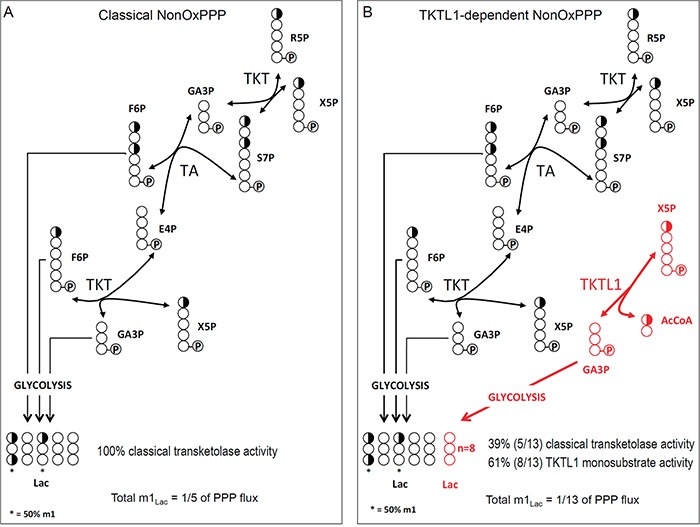
Schematic representation of the classically accepted sequence of reactions of the non-oxPPP A., and the proposed sequence of reactions for the non-oxPPP showing AcCoA production in the one-substrate reaction of TKTL1 (in red) B. Carbons are represented by circles. Half-filled circles represent carbons that have 50% chance of incorporating label from [1,2-13C2]-glucose; open circles represent unlabeled carbons. Circles containing P represent phosphate groups. R5P, ribose-5-phosphate; X5P, xylulose-5-phosphate; GA3P, glyceraldehyde-3-phosphate; S7P, sedoheptulose-7-phosphate; F6P, fructose-6-phosphate; E4P, erythrose-4-phosphate; AcCoA, acetyl-CoA; TKT, transketolase; TA, transaldolase; Lac, Lactate.