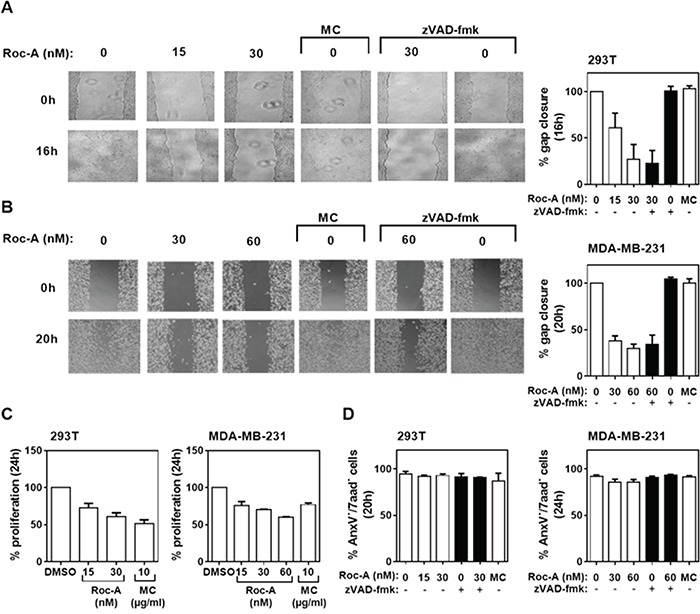
Figure 2. Roc-A inhibits migration of different types of cancer cells.

A and B. Roc-A inhibits cell migration in 293T and MDA-MB-231 cells. 293T and MDA-MB-231 cells were subjected to treatment with different drugs and the percentage of gap closure was quantified as described in Figure 1C and 1D. Representative images are shown. C. Analysis of the effects of different drugs on proliferation in 293T and MDM-MB-231 cells. The percentage of proliferative cells was determined and normalized to DMSO treatment. Results are an average of three independent experiments. Error bars (S.D.) are shown. D. Analysis of the effects of different drugs on cell viability. The percentage of viable cells was determined as AnxV−/7aad− cells 20 h (293T) and 24 h (MDA-MB-231) after drug treatment. Results are an average of three independent experiments. Error bars (S.D.) are shown.
