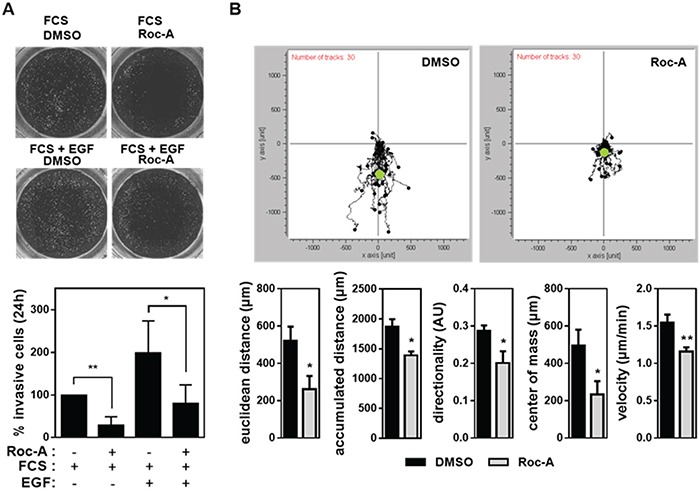
Figure 3. Roc-A inhibits cancer cell invasion and impairs directed cellular migration.

A. Roc-A inhibits PC-3 cell invasion. PC-3 cells were seeded in FCS-free medium on matrigel-coated filters and treated with 15 nM Roc-A or solvent (DMSO). A gradient of FCS and/or EGF was applied by adding 100 ng/ml EGF and/or 5 % FCS to the well below the filter. The upper panel shows the representative image. The lower panel shows the number of invasive cells determined 24 h after treatment and normalized to DMSO-treated cells. Representative images of calcein-stained cells are shown. Results are an average of four independent experiments. Error bars (S.D.) are shown. Asterisks indicate statistical significance with * p < 0.05, **p < 0.01, calculated by unpaired Student's t-test with Welch's correction. B. Roc-A impairs directed cellular migration in PC-3 cells. PC-3 cells were exposed to a gradient of FCS (0-10%) and in parallel treated with 15 nM Roc-A or solvent (DMSO). The upper panel shows the movement of 30 cells per treatment tracked over a period of 24 h. Black dots show relative cell positions over 24 h and the green dot indicates the center of mass at the end of the observation period. The lower panel shows the parameters of cellular migration determined. Results are an average of three independent experiments. Error bars (S.D.) are shown. Asterisks indicate statistical significance with * p < 0.05, **p < 0.01, calculated by unpaired Student's t-test with Welch's correction.
