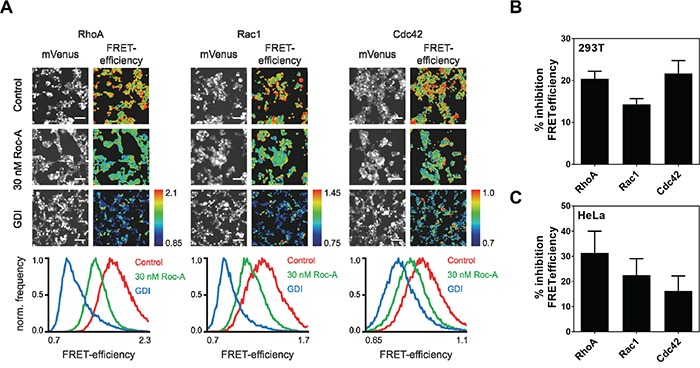
Figure 5. Roc-A inhibits the activity of the Rho GTPases RhoA, Rac1 and Cdc42.

A. Roc-A inhibits the activity of the Rho GTPases RhoA, Rac1 and Cdc42. RhoA, Rac1 or Cdc42 FRET sensors were overexpressed in 293T cells either with a control plasmid (Control, 30 nM Roc-A) or together with GDI. Cells were treated with 30 nM Roc-A or vehicle (DMSO for Control and GDI) for 24h. Representative fluorescence micrographs show mVenus channel of 293T cells expressing the indicated FRET sensors. Scale bars: 100 μm. Pseudocolored FRET efficiency images of the same field of view were calculated as a ratio of FRET acceptor over FRET donor emission intensity reflecting the GTPase activity levels. The histograms show the pixel distribution of the FRET efficiency within the FRET emission ratio images. B. Quantification of A. FRET efficiency was normalized to GDI and DMSO values and % inhibition FRET efficiency was calculated. Results are an average of six independent experiments. Error bars (S.E.M.) are shown. C. Roc-A inhibits the activity of the Rho GTPases RhoA, Rac1 and Cdc42 in HeLa cells. RhoA, Rac1 or Cdc42 FRET sensors were overexpressed in HeLa cells either with a control plasmid (Control, 30 nM Roc-A) or together with GDI. Cells were treated with 30 nM Roc-A or vehicle (DMSO for Control and GDI) for 24h. FRET efficiency was normalized to GDI and DMSO values and % inhibition FRET efficiency was calculated. Results are an average of three independent experiments. Error bars (S.E.M.) are shown.
