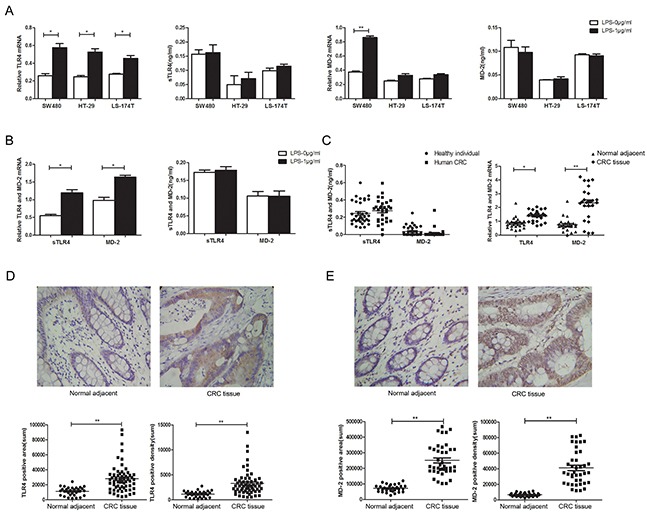
Figure 1. TLR4 and MD-2 expression and its association with the clinic pathological characteristics of CRC patients.

Expression of TLR4 and MD-2 were analyzed by RT-PCR and ELISA in CRC cells A. and PMA-induced THP-1 cell B. Expression of TLR4 and MD-2 were analyzed by ELISA (left) and RT-PCR (right) in CRC patients C. Immunohistochemistry for TLR4 D. and MD-2 E. in CRC patients from surgical samples of controls (normal adjacent tissue, n = 10) and patient samples (CRC tissue, n = 33) (only 1 picture per group was shown). Quantification of positive area (D and E, bottom, left) and positive density (D and E, bottom, right) were both shown. *P < 0.05, **P < 0.01, data were analyzed by unpaired Student's t test. ×400 magnification
