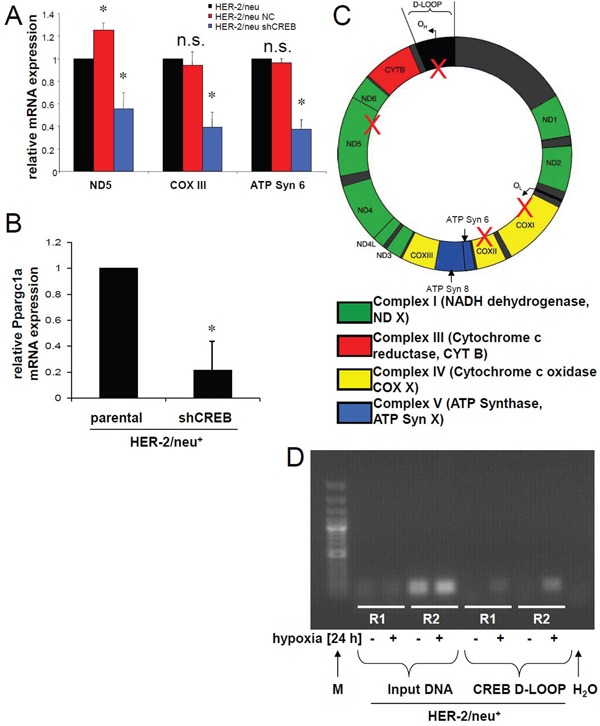
Figure 5. Regulation of the mitochondrial biogenesis via Ppar1a and CREB binding to mitochondrial elements.

A. mRNA expression of mitochondrial encoded genes was determined by real time PCR using gene specific primer. The bar charts represent the data from two independent experiments. B. Expression of Ppargc1a mRNA was quantified by qPCR. The bar charts represent the data from two independent experiments. C. Putative CRE motifs were identified in the mtDNA. The mtD-LOOP has 2 CRE elements and in the protein coding regions 3 other CRE elements were identified. These were marked with a red cross. D. CREB binding DNA was immunoprecipitated, purified and used in a real time PCR. The products were further analysed by 2% agarose gel electrophoresis. IgG rabbit antibody was used as a control. The gel represents two of three independent experiments.
