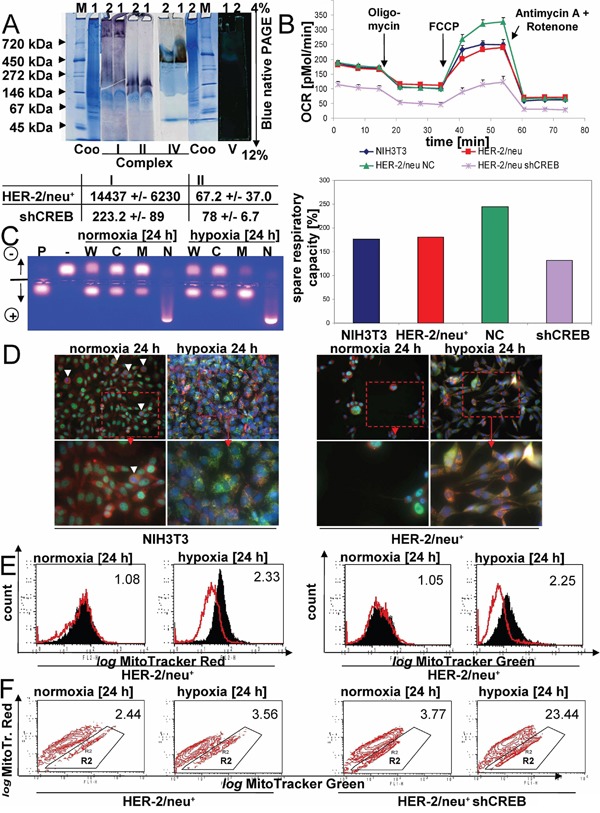
Figure 6. Regulation of mitochondrial functions by mito-CREB.

A. The activity of mitochondrial complexes was analysed by in gel activity. The numbers in A are the mitochondrial proteins from HER-2/neu+ cells (1) and HER-2/neu+ shCREB cells (2). M: representative molecular weight marker. Coo: Colloidal coomassie staining. The staining of complex V (ATP synthase) was documented in front of a dark background. The data beyond the gel staining represents the spectrometrically analysis of the complex I and II activities from three independent experiments. B. Basal oxygen consumption rate (OCR) (an indicator for mitochondrial respiration) was detected using the XF96e Extracellular Flux Analyzer (Seahorse Bioscience). Next, OCR responses towards the application of oligomycin (1 μM), FCCP (2.5 μM), and the combination of antimycin (3 μM), and rotenone (3 μM) (XF Cell Mito Stress Test Kit, Seahorse Bioscience) were evaluated. All experiments were performed in at least hexaplicates. Changes after FCCP application are indicative for the maximal respiratory capacity (up). The spare respiratory capacity was calculated from the results (down). C. The PKA activity of the whole cell lysate (W) and the intracellular fraction (C, M, N) was analysed as described in Materials and Methods. Samples (cultivated for 24 h under normoxia or hypoxia), positive (P) and negative (−) controls were loaded onto an agarose gel. The gel was photographed under UV irradiation. D. The localization of CREB (green), mitochondria (red) and the nucleus (blue) was compared in NIH3T3 and HER-2/neu+ cells under normoxia and hypoxia. White arrows mark dividing cells, which lacks nuclear CREB. Under hypoxic conditions the mitochondrial fission is visible. E. HER-2/neu+ cells and CREB-deficient derivatives were incubated under normoxia and hypoxia for 24 hours, before cells were stained with MitoTracker Green and Red, respectively. F. In the contour plot the cells in R2 represents mitochondrial dysfunctional cells (pos. for MitoTracker Green, weaker staining for MitoTracker Red). 10.000 cells were analysed by flow cytometry.
