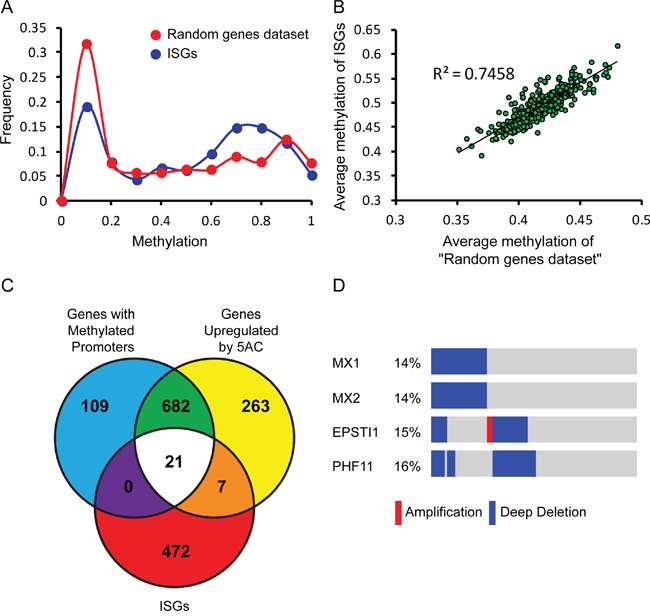
Figure 2. Genetic and epigenetic mechanisms contribute to negative regulation of ISG expression in prostate cancer patient samples and LNCaP cells.

A. Graph depicts the frequency of β values (methylation) of 500 randomly selected human genes (red) or 500 ISGs (blue, [43]) in prostate cancer patient samples (TCGA, cBioPortal, [37–39]). B. Graph depicts a per-patient correlation between the average β value of the 500 randomly selected human genes and the average β value of the 500 ISGs (same data sets as in (A)). C. Venn diagram depicts intersections among gene lists of: “genes with methylated promoters” in LNCaP cells, “genes up-regulated by 5AC treatment” in LNCaP cells [26], and 500 ISGs [43]. D. Graphical depiction of prostate cancer patient samples (TCGA, cBioPortal, [37–39] with deep deletion (blue), amplification (red), or no alteration (gray) of the genetic content of the indicated genes. The percentages of these alterations in the cohort are shown on the left. Patient samples are distributed along the bars; mutations that appear in the same sample are aligned above each other.
