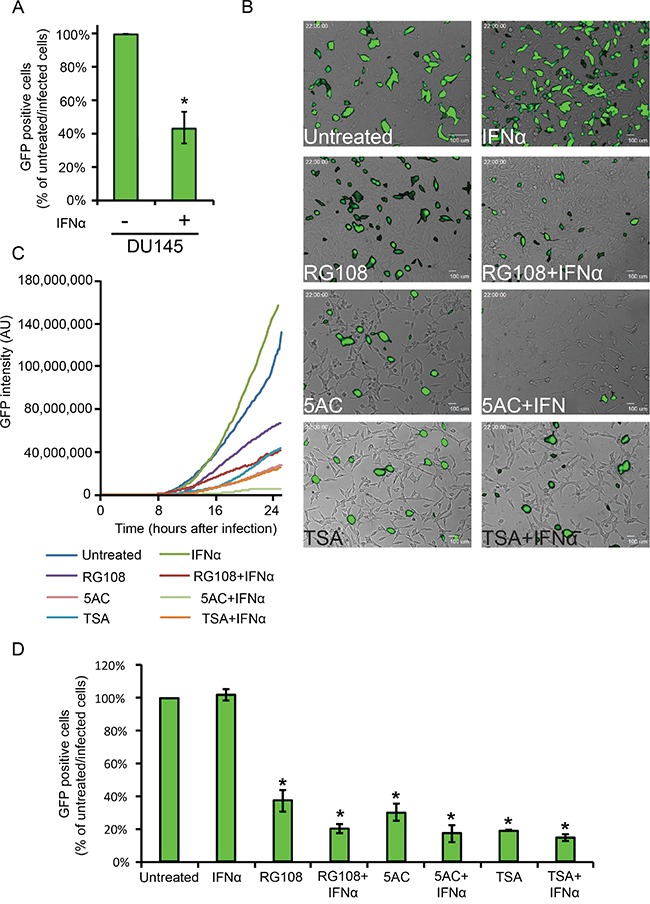
Figure 6. EpMs reduce hMPV-GFP infection in LNCaP cells.

A. DU145 cells were pretreated, or not, with IFNα (200 U/ml, 4h) and infected for 24 h with hMPV-GFP (0.5 m.o.i), prior to FACS analyses of percentage of infected cells. Graph depicts the average ± SD percentage of hMPV-GFP infected cells, where the percentage of infected cells without IFNα treatment is taken as 100%. B. Micrographs depict the 22 h time-point of the live-cell microscopy time-lapse sequences of hMPV-GFP-infected LNCaP cultures, under the indicated conditions of EpM/IFNα treatments. LNCaP cells were pre-treated as in Figure 4 and infected with hMPV-GFP (24 h, in medium conditions identical to pre-treatment). C. Graph depicts the accumulation of GFP signal (normalized to the number of cells in the field) of the hMPV-GFP infections visualized by live-cell microscopy. D. LNCaP cells were pretreated, infected and analyzed as above. Graph depicts the average ± SD percentage of hMPV-GFP infected in the indicated conditions, where the percentage of infected cells without treatments was taken as 100%. *, p<0.005 (compared to untreated/infected cells).
