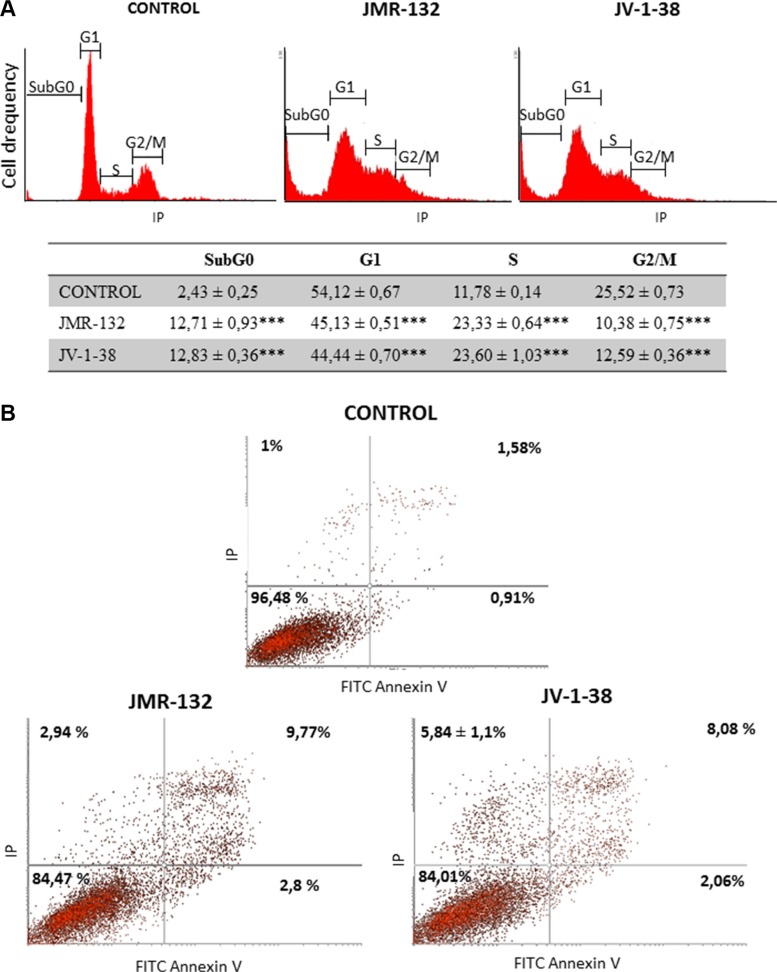
Figure 2. Analysis of cell cycle (A) and apoptosis (B) in PC3 cells after treatment with GHRH antagonists JMR-132 or JV-1-38.
Cells were treated for 8 h (A) and 24 h (B) with 0.1 μM GHRH antagonists. The results are shown as percentage of cells in each phase of the cycle (A) and, early (Lower right) and late (Upper Right) apoptotic cells (B), as compared to untreated control cells. A representative experiment is shown. Data in the table are the means ± SEM of four independent experiments; ***p < 0.001 vs. control.

