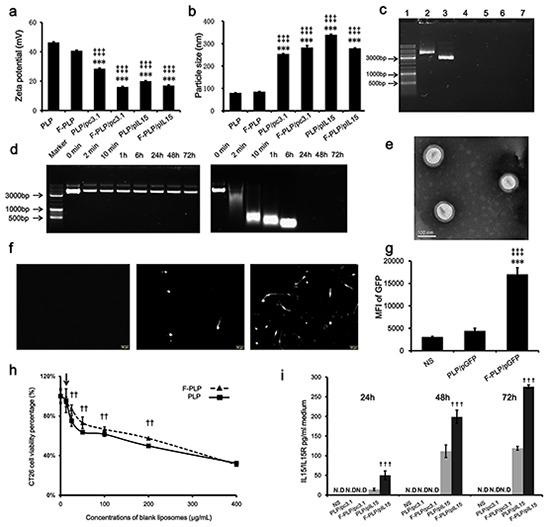
Figure 1. Physicochemical properties of F-PLP/pIL15.

a. Zeta-potential of liposomes and lipoplexes (***P < 0.001, versus PLP; ‡‡‡P < 0.001, versus F-PLP; mean ± SD, n = 3). b. Particle size of liposomes and lipoplexes (***P < 0.001, versus PLP; ‡‡‡P < 0.001, versus F-PLP; mean ± SD, n = 3). c. Gel retardation assay of DNA and lipoplexes. Lane 1, DNA marker; lanes 2 and 3, naked pIL15 and pc3.1; lane 4, PLP/pIL15; lane 5, F-PLP/pIL15; lane 6, PLP/pc3.1; and lane 7, F-PLP/pc3.1. d. F-PLP/pIL15 stability in the presence of DNase. Left panel: F-PLP/pIL15 could protect pIL15 from DNase degradation for 72 h at 37°C; Right panel: naked pIL15 was completely degraded after a 2 min DNase incubation at 37°C. e. TEM image of F-PLP/pIL15. f. GFP expression fluorescent images (scale bars = 50 μm). g. Transfection efficiency of F-PLP/pDNA complexes in the CT26 cell line (MIF, mean fluorescence intensity; **P < 0.01, versus NS; ‡‡P < 0.01, versus PLP/pGFP; mean ± SD, n = 3). h. IL15 expression detected by ELISA assay (N.D., not detected; †††P<0.001, versus PLP/pIL15; mean ± SD, n = 3). i. The cytotoxicity of liposomal carriers on CT26 cells (arrow represents 12.5μg/mL, which was the concentration of liposomal carriers used in transfection test in vitro; ††P < 0.01, versus PLP; mean ± SD, n = 3).
