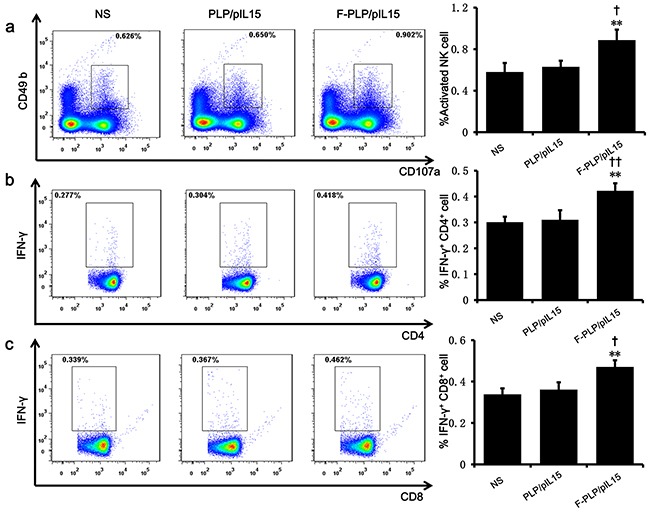
Figure 3. Induction and activation of NK cells and the increasing of IFN-γ+ cytotoxic T cells.

a. A splenic single cell suspension was analyzed by flow cytometry for the presence of activated NK cells CD49b+CD107a+. The increase of CD4+IFN-γ+ b. and CD8+IFN-γ+ c. cytotoxic T cells were examined with quantitative flow cytometry (**P < 0.01, ***P < 0.001, versus NS; †P < 0.05, ††P < 0.01, versus PLP/pIL15; mean ± SD, n=3).
