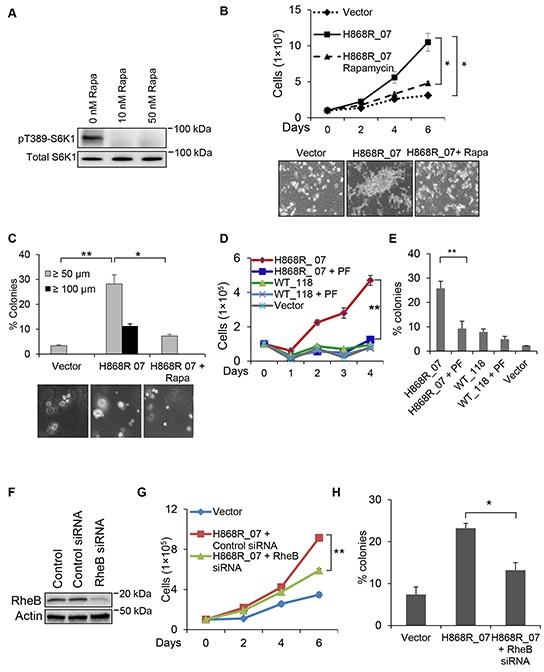
Figure 7. mTOR/S6K1 signaling pathway is necessary for VPS34-induced oncogenic transformation.

A. VPS34-H868R_07 cells were treated with rapamycin (Rapa) for 1h at the indicated concentrations or left untreated. The levels of pT389-S6K1 in WCL were detected by Western blot analysis using antibody directed against pT389-S6K1. B. Growth profiles (1% CS) of Vector cells and H868R_07 cells treated with rapamycin (10 nM) or left untreated for the indicated time. Data are representative of two or more experiments and presented in the form of mean ± STDEV (*, p < 0.05); Lower panel: phase-contrast micrographs of representative images from the indicated cell lines cultured in low serum media for six days (magnification, ×100). C. Experimental procedures for the soft agar assay were essentially the same as described in Figure 6D except that H868R_07 cells were treated with rapamycin (10 nM) or left untreated. Upper panel bar graph are representative of two or more experiments and presented in the form of mean ± SEM (*, p < 0.05; **, p < 0.01). Lower panel shows the phase-contrast micrographs of representative images from the indicated cell lines (magnification, ×100). Images were captured on day 21. D. Vector, WT_118 and H868R_07 cells were seeded in duplicate in DMEM media containing 1% CS. WT_118 and H868R_07 cells were treated with PF-4708671 (10 μM) for the indicated times or left untreated. At the indicated days, cells were harvested and counted. Line graph is representative of two or more experiments and presented in the form of mean ± SEM (**, p < 0.01). E. Vector, WT_118, and H868R_07 cells were seeded in 6-well plate in soft agar containing 10 μM PF or 0 μM PF. After 3 weeks, colonies were counted with criterion ≥50 μm. Bar graph is representative of two or more experiments and presented in the form of mean ± SEM (**, p < 0.01). F. Western blot analysis was done to show RheB knockdown in NIH3T3 cells that were transfected with either control of RheB siRNA. G. Vector and H868R_07 cells were seeded in duplicate in DMEM media containing 1% CS. H868R_07 cells were transfected with RheB siRNA or left non-transfected. At the indicated days, cells were harvested and counted. Line graph is representative of two or more experiments and presented in the form of mean ± SEM (**, p < 0.01). H. Soft agar colony formation assay for vector, H868R_07 and H868R_07 + RheB siRNA. Bar diagram is representative of two or more experiments and presented in the form of mean ± SEM (*, p < 0.05).
