
Figure 5. The effect of TGF-β/SNAIL on the polarization of BMDMs.
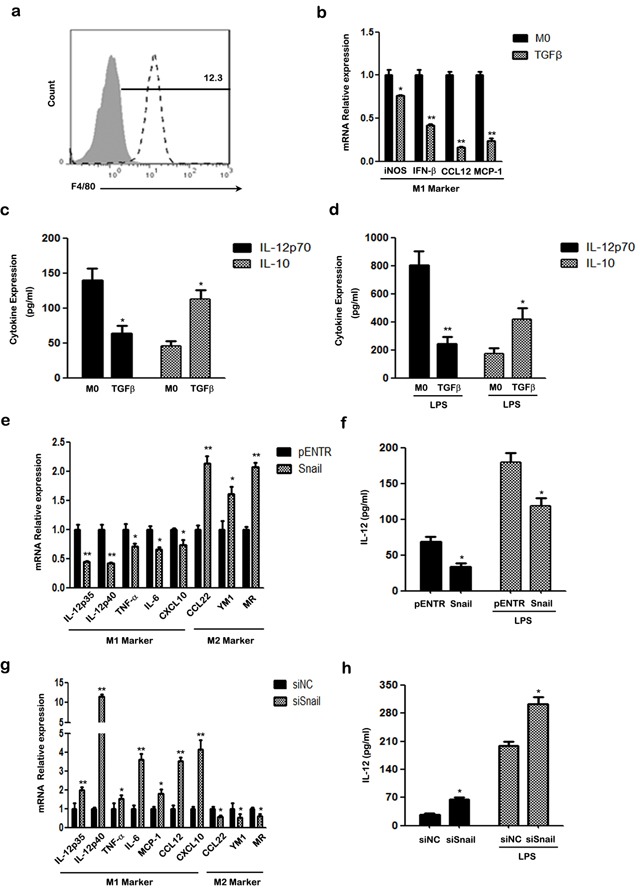
a. FACS analysis of cell surface marker F4/80 in BMDMs using specific mAbs (unfilled histograms) or isotype-matched mAbs (closed histogram). b. The mRNA levels of iNOS, INF-β, CCL12, MCP-1 of treated BMDMs were detected by qRT-PCR. c. Secretion of murine IL-12p70 and IL-10 was examined using ELISA. d. ELISA analysis of murine IL-12p70 and IL-10 production in treated BMDMs, after treatment with LPS for another 24 h. e. The mRNA levels of M1/2 hallmarks IL-12p35, IL-12p40, TNF-α, IL-6, CXCL10, CCL22, YM1, MR in SNAIL overexpression BMDMs were detected by qRT-PCR. f. ELISA analysis of murine IL-12p70 production in supernatant of SNAIL transfected BMDMs with or without LPS stimulation for another 24 h. g. The mRNA levels of the M1-specific markers IL-12p35, IL-12p40, TNF-α, IL-6, MCP-1, CCL12, CXCL10 and M2-specific markers CCL22, YM1 and MR in SNAIL-silencing BMDMs were determined by qRT-PCR. h. The production of murine IL-12p70 of SNAIL-silencing BMDMs with or without LPS stimulation was measured by ELISA. * p < 0.05 and ** p < 0.01 compared with control. Results represent mean ± SD of three separate experiments.