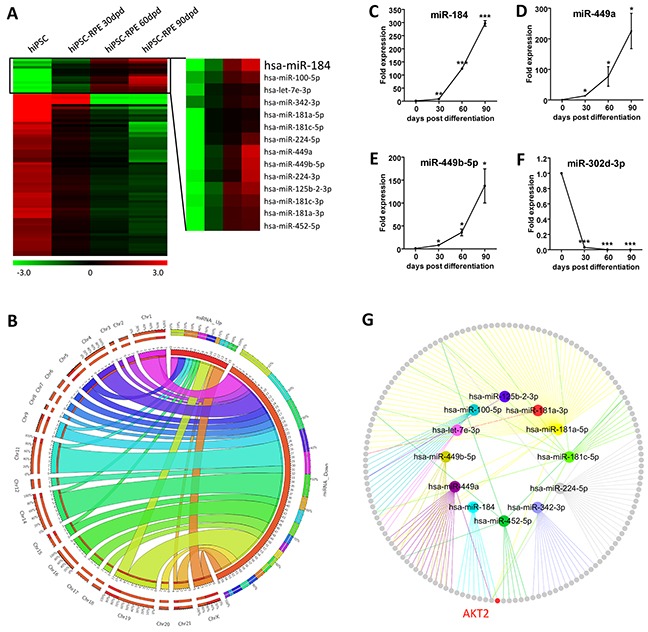
Figure 2. Expression profiling of miRNAs.

A. Hierarchical clustering of all 78 concordantly differentially expressed miRNAs. Hsa-miR-184 was constantly up-regulated along with the differentiation from hiPSC to RPE. Green: down-regulated miRNAs; red: up-regulated miRNAs. B. Chromosomal locations of the 78 differentially expressed miRNAs were presented as a Circos plot. C-F. Four differentially expressed miRNAs with fold change of over 2 among all time points, including the up-regulated hsa-miR-184 (C), hsa-miR-449a (D), hsa-miR-449b-5p (E), and the down-regulated hsa-miR-302d-3p (F), were selected for validation of the microarray results in hiPSC-RPE at 0, 30, 60, and 90 dpd. (G) Network among all up-regulated miRNAs and their respective experimentally confirmed mRNA targets. The upregulated miRNAs were labeled. Colored nodes: miRNAs; grey nodes: mRNAs; colored edges: miRNA-target interaction.*: p<0.05; **: p<0.01; ***: p<0.001.
